Short-Term Turns Down – Q4 Studies Still Point Higher
In today’s blog, I am going to share some very short-term comments first and then expand those to October and Q4 after the two charts I post.
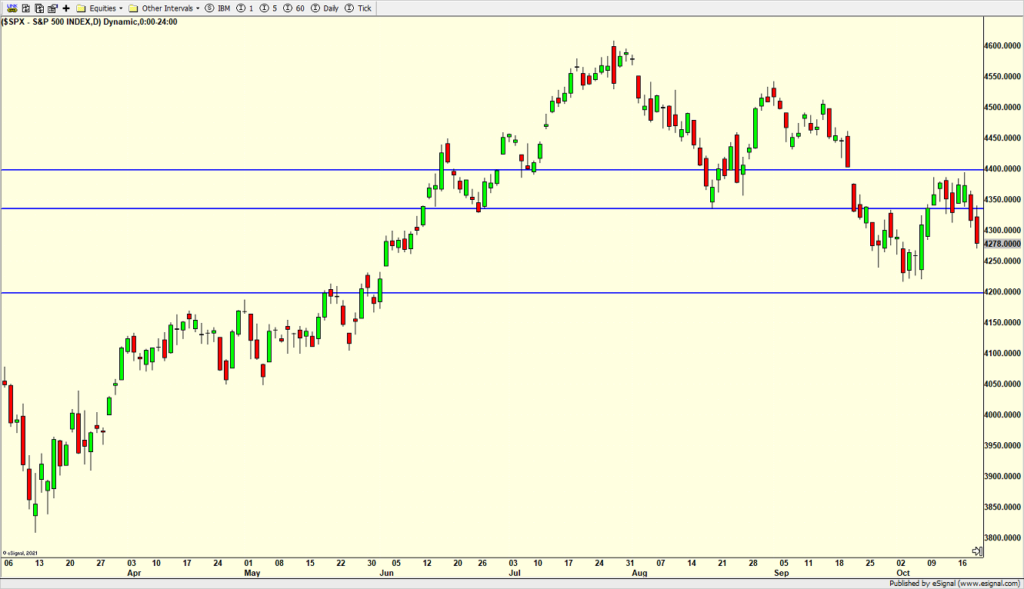
The stock market did not make it back up to the 4400 level I discussed earlier in the week and last week. Rather, it turned south and now appears to be heading towards the 4200 area which coincides with where the decline stopped earlier this month as well as where the popular average price of the last 200 days resides. Some will argue that perhaps a new range is being established between 4200 and 4400. I am not one of them. I think this incursion lower should be the final pullback before 4400 is exceeded on the upside. The S&P 500 should find buyers somewhere between 4225 and 4200, give or take.
(Click on image to enlarge)

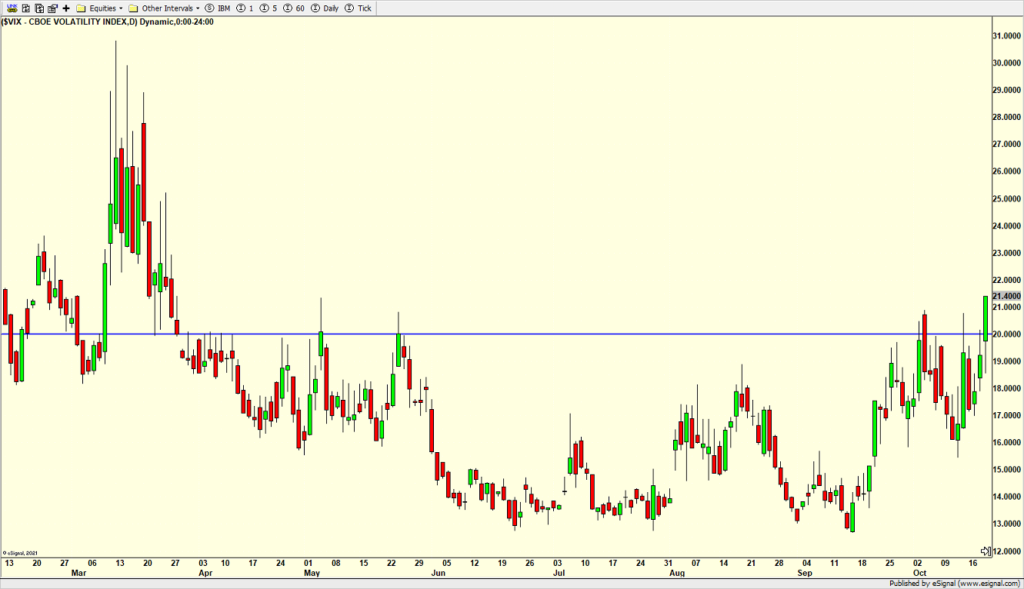
More than a few times, I have complained that the Volatility Index (VIX) did not see a spike above 20. It was just a venture, nothing too serious. Remember, that during declines the VIX goes up as price goes lower. Stock market bottoms are typically (but not always) made when the VIX spikes. And that spike is usually above 20. After Thursday, it looks like it is building towards a spike higher.
(Click on image to enlarge)

Several folks have asked about what makes Q4 so positive for stocks and what studies I can cite to support that. First, when you synthesize Q4 in all years and then only take pre-election years, stocks usually bottom by mid-October, the latter is even more powerful like we have today. Over the summer I discussed that lows in August, September, and October could be seen. August and September came in. Now, we are waiting for October.
When you look at years when the S&P 500 was down at least 1% in August and September, October was up 10/13 years and the last 4 straight, averaging more than 4%. So far, October is flat. For Q4, 12/13 have been up, including the last 10 straight, averaging 7.5%. This study is courtesy of my friend, Ryan Detrick from Carson Group. I look forward to spending some time with Ryan next month in Chicago.
The other study I tinkered with and had to some curve fitting involves how much the S&P 500 is up through September 30. In years when it’s ahead 10-20%, October’s median return has been up 1.6% with Q4 clicking in at 5.5%. October was up 4 out of the last 4 while Q4 was ahead 8 of the last 9.
Now, I have also been asked “what if you are wrong?”
Well friends, I ask that question to myself at least daily throughout every single year. That’s my job. Of course, I am going to be wrong. As you know, another saying I often quote is that it’s okay to be wrong. It’s not okay to stay wrong. In other words, where my forecast is clearly a stinker, I better pivot and figure out the next step because in this business, the markets are usually right.
As hard to believe as it is, CT is about to see it’s 15th rainy weekend out of the last 19. I am running out of fingers and toes to count. It’s just not fair, especially in the fall when New England is usually perfect.
On Wednesday we bought EPOL. We sold TUR, XLV, some DIA, and some FMAT. On Thursday we sold DIA, FMAT, SSO, MAS, and KKR.
More By This Author:
Medicare, Social Security And A Drop In Stock Market RiskMore Evidence Of The Bottom
Better Be Watching The Dollar
Please see HC's full disclosure here.


