
Sector Performance YTD: Energy Dominates
Earlier today in our Morning Lineup post, we highlighted the incredibly wide disparity between the performance of the S&P 500 Energy sector and the rest of the index. To further illustrate the divide, the charts below show the average YTD performance of S&P 500 stocks by sector as well as the percentage of stocks in each sector that are up YTD.
Starting with average performance, stocks in the Energy sector are up an average of 21.6% YTD which is more than 18 percentage points higher than the next closest sector (Financials). Energy is also one of just two sectors in the S&P 500 where the average YTD return of stocks in the sector is positive. For all the stocks in the S&P 500, the average YTD change is a decline of 4.1%, and in the Technology sector, its individual components are already down an average of just over 10% YTD!

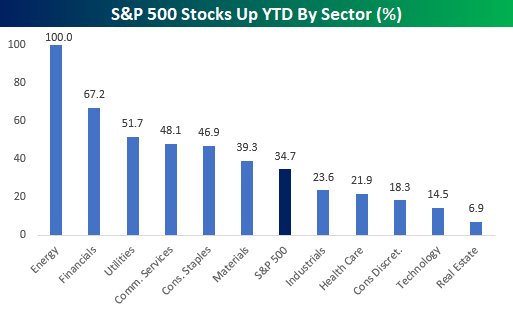
With stocks in the Energy sector up an average of over 20% YTD, it shouldn’t come as too much of a surprise that every stock in the sector has posted YTD gains. After Energy, Financials and Utilities are the only two other sectors where more than half of the components are up YTD. For the S&P 500 as a whole, barely more than a third of stocks in the index are up YTD while less than 15% of Technology stocks and just 6.9% of stocks in the Real Estate sector (2 out of 29) are in the black. A number of strategists have said 2022 will be the year of the stockpicker, but so far this year, it’s been increasingly difficult for those stockpickers to find winners – especially outside of the Energy sector.
See more in-depth market analysis from Bespoke by starting a two-week trial to Bespoke Premium ...
more

