

Photo by Jason Briscoe on Unsplash
Good morning and happy Friday, on what is likely to be one of the most uneventful trading days this year. US equity futures are fractionally lower, treasury yields are little changed, and crude oil is slightly higher. The only area of the market with real activity is in gold and other metals. The yellow metal is up “only” 0.75% to $4,537 per ounce, but silver is up close to 4%, while Platinum is up double that, trading at 2,414.40 per ounce. On December 10, platinum closed at $ 1,647.50, and in the 16 days since then, it has rallied by 47%.
While it has been a quiet week for US equities, Asian markets haven’t been sleeping on Christmas. Overnight, the Nikkei rallied 0.7% to take its weekly gain to 2.5% while South Korea gained 0.5% for a total weekly gain of 2.7%. There was some welcome inflation news as Tokyo CPI slowed to 2.0% y/y and 2.3% y/y on a core basis. Despite that news, two-year JGB yields hit the highest level since 1996. In Europe, markets are even quieter than they are here as most countries remain closed for the Christmas holiday.
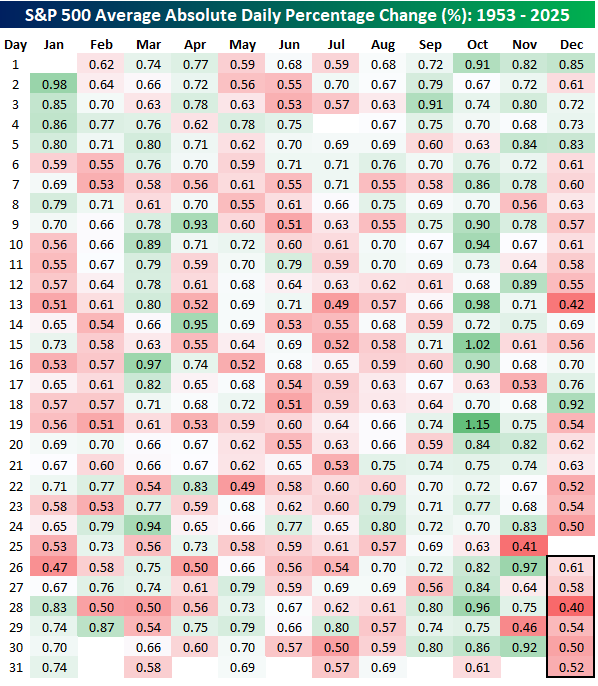
The S&P 500’s average daily move since 1953 has been up or down 0.67%, but that hasn’t been the case in the final week of December or the second half of the month, for that matter. The table below is like the one from our Chart of the Day from Tuesday (12/23), where we looked at the S&P 500’s average and median daily change for every day of the year. In this one, we show the S&P 500’s average daily percentage move (up or down) for every day of the year since 1953.
Volatility on the day after Christmas has been below average with an average daily move of 0.61%, but it still tends to be the most volatile day of the year between Christmas and year-end. The least volatile day of the week and the year, for that matter, is December 28th (0.40%). 12/28 falls on Sunday this year, but volatility on every day of the post-Christmas period is below the overall average. For December, volatility has been below average on 73% of all trading days, and the only month with more below average volatility days is July (80%). Conversely, October has the highest percentage of above average volatility days (87%).
The chart below shows the average absolute daily change for every day of the year (gray line) along with the 10-day moving average. We’re entering the final days of the year, and volatility is very low, but December 31st marks the low point of the year. From there, it will start to rise in the first few days of the new year. For much of the year, though, volatility tends to stick close to the average. The only real exceptions besides late December are mid-July, when volatility is also subdued, and then mid-March and October, when volatility starts to heat up. For now, though, it’s just cold!

More By This Author:
Hi Ho SilverOracle Pain Continues
Regional Strength


Comments
Log in or sign up to join the conversation.