

Image Source: Unsplash
Walmart (WMT - Free Report) shares have lagged during the market’s bounce off the October 2022 lows, but have otherwise been stalwart performers in the broader market sell-off that got underway at the start of 2022. You can see this in the chart below that shows the one-year performance of Walmart relative to the S&P 500 index (green line) and the Zacks Retail sector (red line).
Since the October lows, Walmart shares are up +11.3% while the S&P 500 index has gained +13.2%.
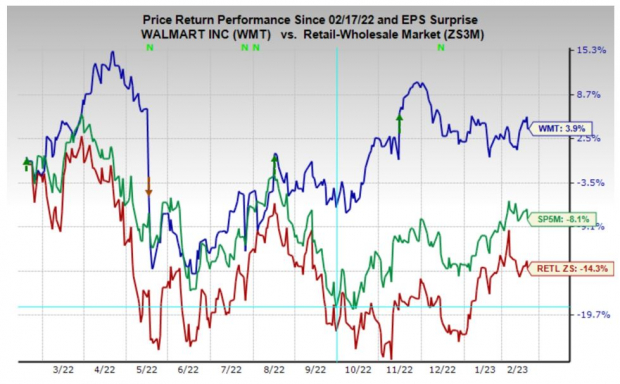
Image Source: Zacks Investment Research
The stability in Walmart shares makes intuitive sense, as its core business offers a high degree of defense during periods of economic instability and uncertainty. Walmart’s ‘value orientation’ allows it to gain market share as relatively better-off consumers ‘trade down’ during times of ‘economic stress’. This almost ‘staple’ aspect of Walmart’s business can also be seen in the recent stock market behavior of Costco (COST - Free Report) and others.
Target (TGT - Free Report) shares stand out for their underperformance, but that is more reflective of management’s missteps in executing in the post-Covid environment. Also, relative to Walmart and Costco, Target has a relatively smaller grocery business and has relatively more exposure to discretionary spending categories.
Walmart is expected to report essentially flat earnings on +4.4% higher revenues in its quarterly report before the market’s open on Tuesday, February 21st. The market liked what it saw in the company’s last two quarterly reports on November 15th and August 16th, 2022.
Target will be releasing its quarterly results a week later on February 28th. Target shares were down big in response to each of the preceding three quarterly releases, with the May 2022 release particularly notable. Analysts have generally lowered their Target estimates since the company’s last quarterly report on November 16th, while the same for Walmart has been modestly positive.
With respect to the Retail sector 2022 Q4 earnings season scorecard, we now have results from 17 of the 33 retailers in the S&P 500 index. Total Q4 earnings for these retailers are down -48.9% from the same period last year on +6.8% higher revenues, with 64.7% beating EPS estimates and 58.8% beating revenue estimates.
The comparison charts below put the Q4 beats percentages for these retailers in a historical context.
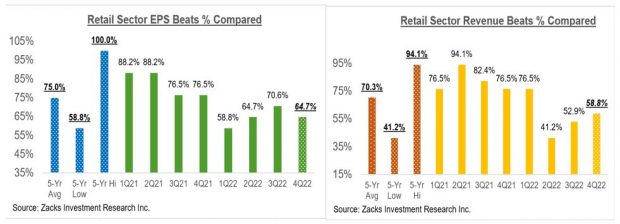
Image Source: Zacks Investment Research
As you can see above, retailers have been struggling to come out with positive surprises thus far, with the variance relative to the historical ranges particularly notable on the EPS side.
With respect to the earnings and revenue growth rates, Amazon’s -85.4% earnings decline plays a significant role in the group’s weak year-over-year growth rate for the sector (Amazon is part of the Zacks Retail sector, and not the Zacks Technology sector). Most of the Retail sector earnings reports that have come out already are in the digital part of the space, with the more traditional retailers starting to report results this week.
As we all know, the digital and brick-and-mortar operators have been converging for some time now, with Amazon now a decent sized brick-and-mortar operator after Whole Foods and Walmart a growing online vendor. This long-standing trend got a huge boost from the Covid lockdowns.
The two comparison charts below show the Q4 earnings and revenue growth relative to other recent periods, both with Amazon’s results (left side chart) and without Amazon’s numbers (right side chart).
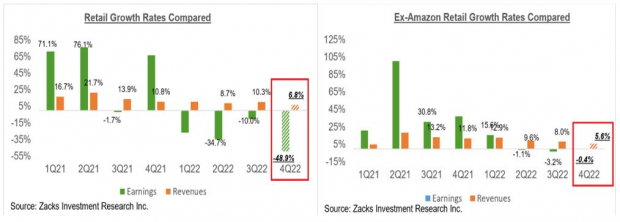
Image Source: Zacks Investment Research
This Week’s Reporting Docket
We have more than 600 companies on deck to report results this week, including 60 S&P 500 members. Notable companies reporting this week, aside from the aforementioned retailers include Nvidia, Alibaba, eBay, Home Depot and others.
2022 Q4 Earnings Season Scorecard
As of Friday, February 17th, we now have Q4 results from 407 S&P 500 members or 81.4% of the index’s total membership. Total earnings for these companies are down -5.5% from the same period last year on +5.9% higher revenues, with 70.3% beating EPS estimates and 71.3% beating revenue estimates.
The comparison charts below put the EPS and revenue beats percentages in Q4 in a historical context.
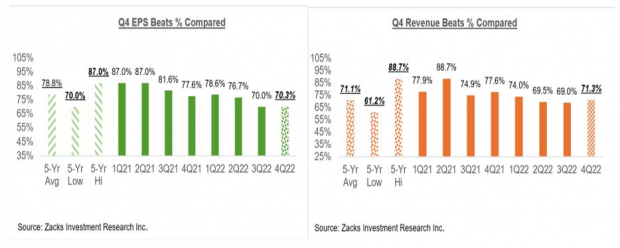
Image Source: Zacks Investment Research
The comparison charts below put the earnings and revenue growth rates in Q4 in a historical context.
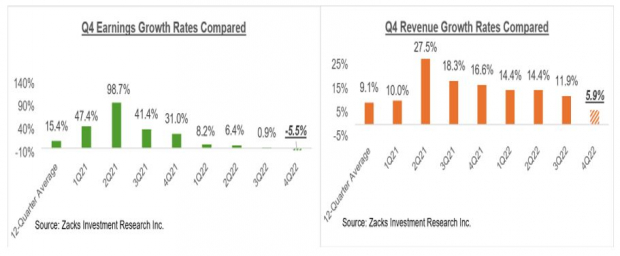
Image Source: Zacks Investment Research
As you can see, there is a notable deceleration in the growth trajectory, both for earnings as well as revenues. Please note that this decelerating growth trend doesn’t change in any meaningful way whether we look at it on an ex-Finance or ex-Tech bases.
The Earnings Big Picture
We have all along been referring to the overall picture that emerged from the 2022 Q4 reporting cycle as good enough; not great, but not bad either.
The revisions trend continues to be negative, with the outlook for a number of sectors on the weak side. But it is consistent with the evolving macroeconomic picture and far from the dire scenario that many in the market feared. You can see this in the chart below that shows how estimates for the current period (2023 Q1) have evolved in recent weeks.
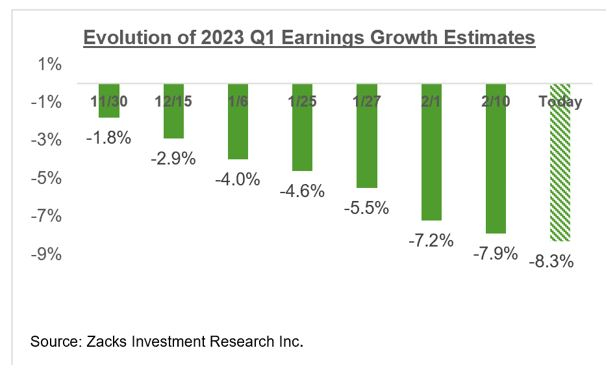
Image Source: Zacks Investment Research
Please note that while Q1 estimates are coming down, the pace and magnitude of cuts is notably below what we had seen ahead of the start of the last couple of earnings seasons.
The chart below shows the aggregate earnings total for the index since the start of last year.
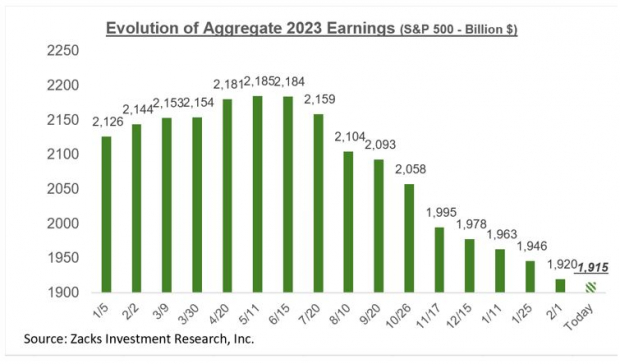
Image Source: Zacks Investment Research
Please note that the $1.915 trillion in expected aggregate earnings for the index in 2023 approximate to an index ‘EPS’ of $215.89, down from $216.09 last week and the $216.18 tally we are on track to have seen in 2022.
The chart below shows this 2023 index ‘EPS’ estimate has evolved since the start of 2022.
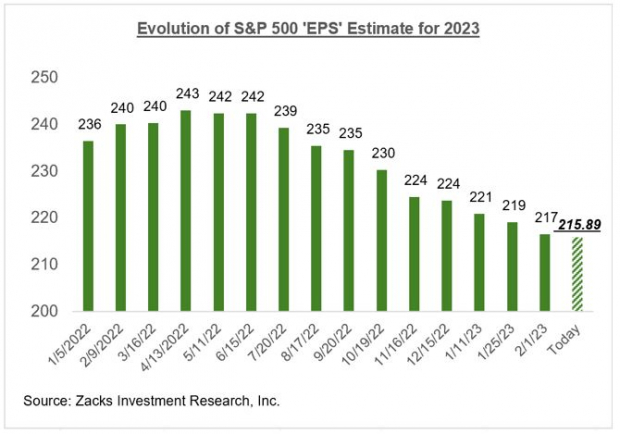
Image Source: Zacks Investment Research
With the bulk of the 2022 Q4 reporting cycle now behind us, revisions have mostly played down for the next few weeks though the Retail sector results will have a bearing on how expectations for that space evolve.
We continue to believe that a definitive read on the revisions front will only emerge once we have seen an end to the Fed’s tightening cycle and the impact of the cumulative tightening on economic growth.
That said, relative to pre-season doom-and-gloom worries, this is a fairly reassuring outcome.
The chart below shows the expected 2022 Q4 earnings and revenue growth expectation in the context of where growth has been in recent quarters and what is expected in the next few quarters.
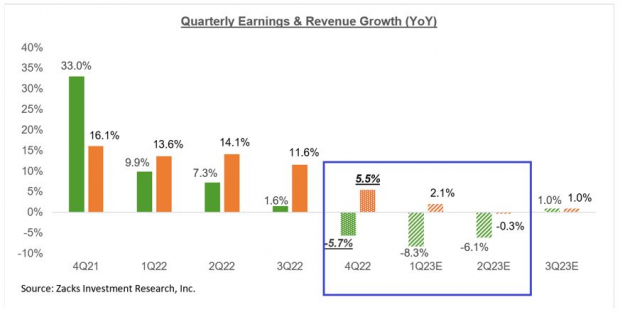
Image Source: Zacks Investment Research
The chart below shows the overall earnings picture on an annual basis.
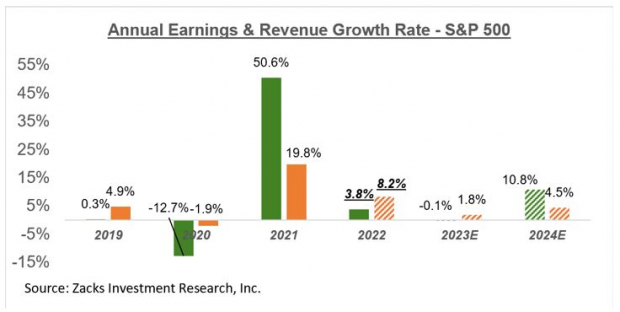
Image Source: Zacks Investment Research
As you can see here, estimates for 2023 are now a hair below the 2022 level.
More By This Author:
Making Sense Of Earnings Revisions: Do They Support The Bullish Start To 2023?
Making Sense Of Apple, Amazon And Big Tech Earnings
Q4 Earnings Season Scorecard And Analyst Reports for Apple, Meta & Mastercard


Comments
Log in or sign up to join the conversation.