“Presidential” Stocks In A Trump Comeback
Image Source: Unsplash
In a twist that few saw coming, Donald Trump clinched a comeback victory, reigniting his signature style and policy focus in the White House. The markets roar, tremble, and speculate as Wall Street attempts to decode this new era of “America First” economics, a revived Trump playbook, and promises of booming industries. With the dust settling, investors are on high alert: Which stocks will thrive under Trump’s unique brand of leadership?
When Trump first took office, he made waves in sectors like defense, traditional energy, and financials; he favored industries that aligned with his pro-business, domestic-focused agenda. Now, with Trump 2.0 in the White House, we’re diving into a potential golden age for “presidential stocks”—companies primed to rise with policy shifts that could drive the market.
Betting Big on America’s Core Industries
Historically, Trump has shown clear favoritism toward industries that build, secure, and fuel America. Now, as he steps back into the Oval Office, he’s expected to double down on these industries with policies that could unleash their full potential.
ExxonMobil and Chevron have long been power players in American oil. Under Trump’s watch, these oil giants could see renewed growth, with a return to aggressive fossil fuel policies and reduced regulations. Known for supporting U.S. energy independence, Trump is expected to lift restrictions and champion drilling rights, creating a boom for energy stocks.
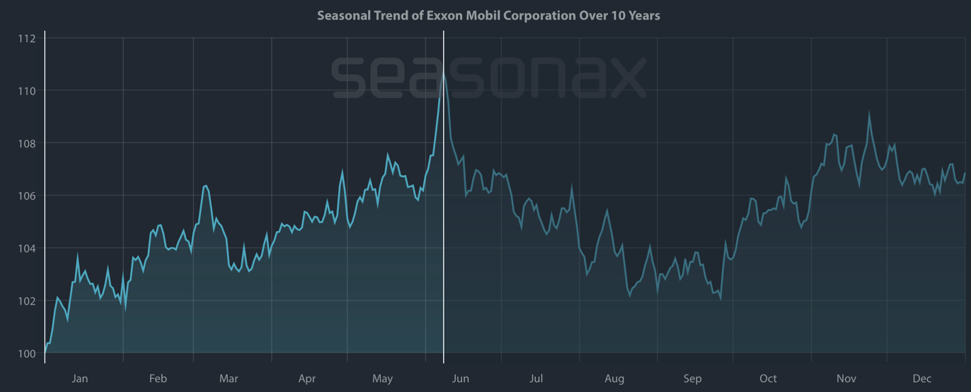
Seasonal pattern of ExxonMobil over the past 10 years
(Click on image to enlarge)

Source: Seasonax
Keep in mind that the seasonal chart shows the average price pattern of the stock calculated over recent years. The horizontal axis shows the time of the year, and the vertical axis shows the percentage changes in the value of the stock (indexed to 100).
Over the past decade, ExxonMobil has shown a strong seasonal trend in the first and second quarters, often delivering peak returns in the early part of the year.
Defense Powerhouses – Locking in National Security Dollars
A Trump Presidency wouldn’t be complete without heavy spending on national defense. Lockheed Martin (LMT), Northrop Grumman (NOC), and Raytheon Technologies (RTX) could be poised for lucrative government contracts as Trump signals his dedication to national security.
Lockheed Martin and Raytheon often see seasonal strength in the first half post-election as defense budgets are released and contracts flow. Historically, they also experience performance peaks when national security concerns are front and center—conditions almost guaranteed in a Trump-led era.
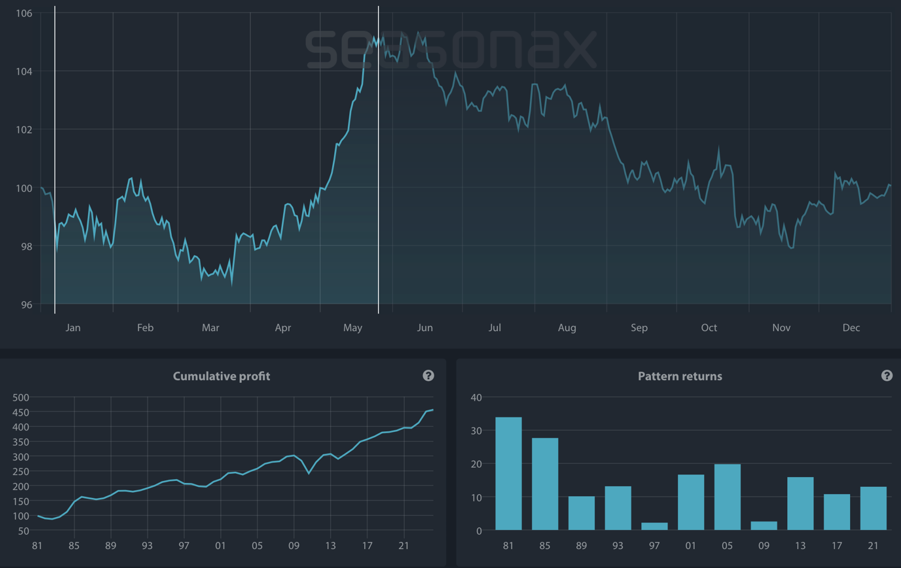
Lockheed Martin has shown a robust seasonal pattern in post-election years, with a strong performance from January 7 to May 26. Over this timeframe, the stock has averaged a 14.7% gain across 97 trading days. Since 1981, returns during this period have been consistently favorable in each post-election year, as highlighted in the bar chart below.
Seasonal pattern of Lockheed Martin in post-election years since 1981
(Click on image to enlarge)

Source: Seasonax
Tech Titans: Powering Up in a New Administration
Another sector Trump seems to favor is technology, and it’s hard to overlook the impact on major players like Microsoft, Amazon, and Alphabet (Google’s parent company). These giants are well-positioned for potential gains as Trump’s administration leans into AI initiatives and ramps up Department of Defense funding, creating prime opportunities for tech advancements.
If you’re considering a long-term investment in these sectors, understanding potential favorable entry points can be just as important as identifying the right stocks. Interestingly, each of these three stocks has historically underperformed toward the end of the year, which could present an attractive buying opportunity for investors.
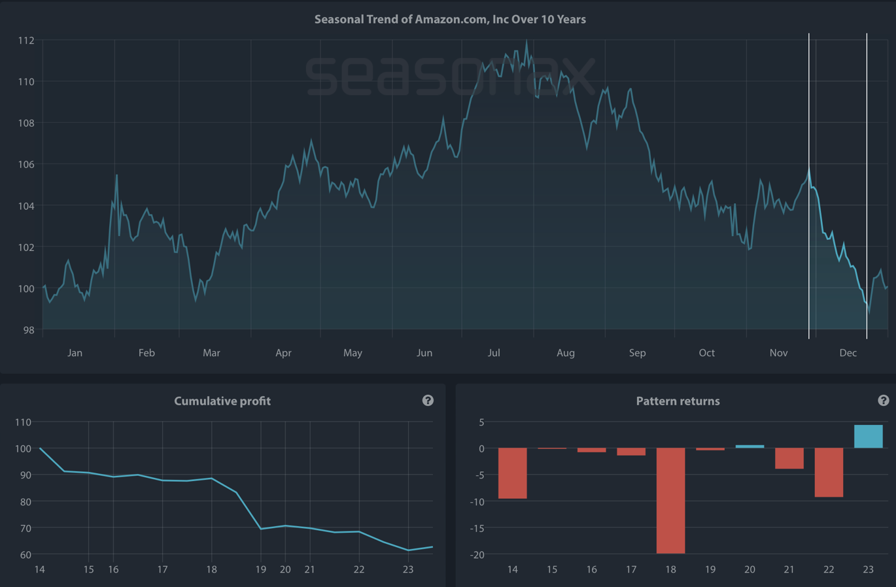
Detrended seasonal chart of Amazon over the past 10 years
(Click on image to enlarge)

Source: Seasonax
*Using Seasonax’s detrended charts can help investors visualize these seasonal lows and highs, stripping out long-term upward trends and revealing hidden cyclical patterns that could influence strategic timing.
From November 28 to December 23 over the past decade, Amazon has shown a consistent downward trend, delivering an average loss of over 4.3% during this period.
For long-term investors, timing entries during these seasonal dips could enhance the potential for growth over time.
But it doesn’t stop there—Tesla has also ridden a wave of success, with its stock soaring after Trump’s election victory. This surge comes in part thanks to CEO Elon Musk’s vocal support for Trump, sparking investor enthusiasm and propelling Tesla into the spotlight as a symbol of innovation in the new administration.
More By This Author:
Top Halloween Stocks To Watch
The Next Big Move: September Fed Meeting
Year-End Stock Market Rally: Myth Or Reality?
Disclaimer: Past results and past seasonal patterns are no indication of future performance, in particular, future market trends. seasonax GmbH neither recommends nor approves of any particular ...
more


