

Image Source: Pixabay
At the close of trading last Friday, we were left wondering over the weekend if the small H&S bottom on this 15-minute line chart for the HUI was going to be valid. We got our answer on Monday with more follow-through to the upside at the close of trading today.
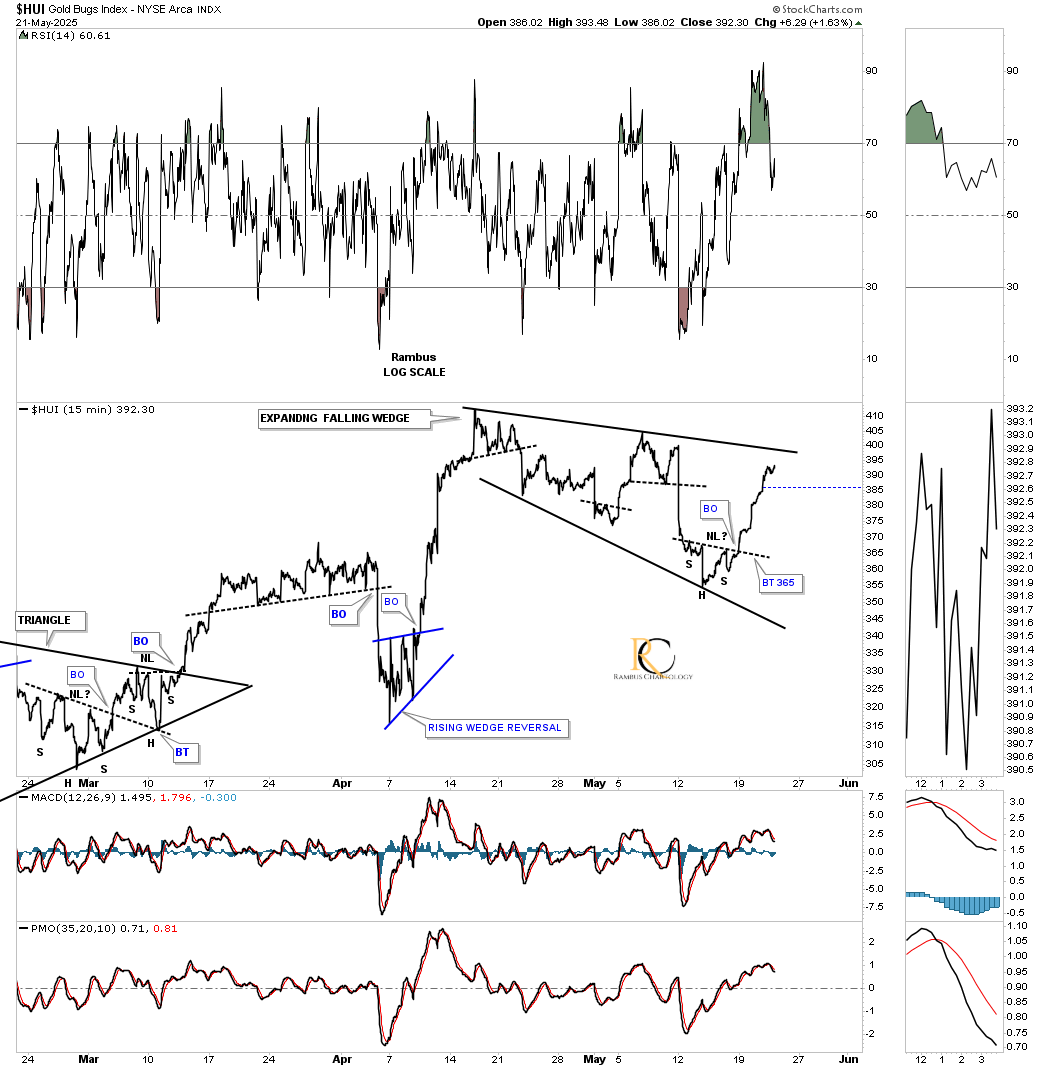
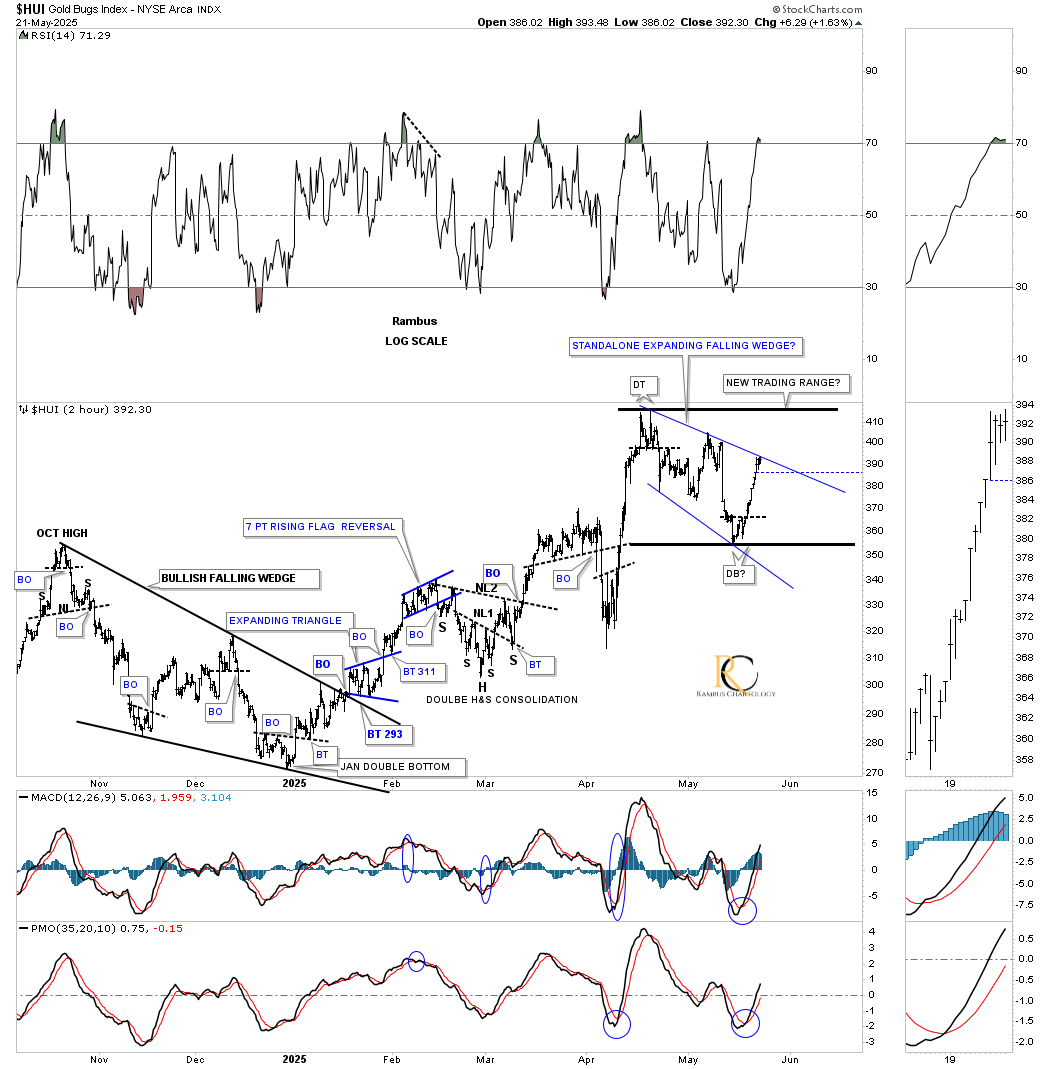
This long-term 2-hour chart shows the HUI closed just below the top rail of the blue expanding falling wedge today. Another question we still don’t have an answer for yet is whether the blue expanding falling wedge is going to be a standalone pattern that will lead to new highs for this move, or if the HUI is going to form a larger consolidation pattern.
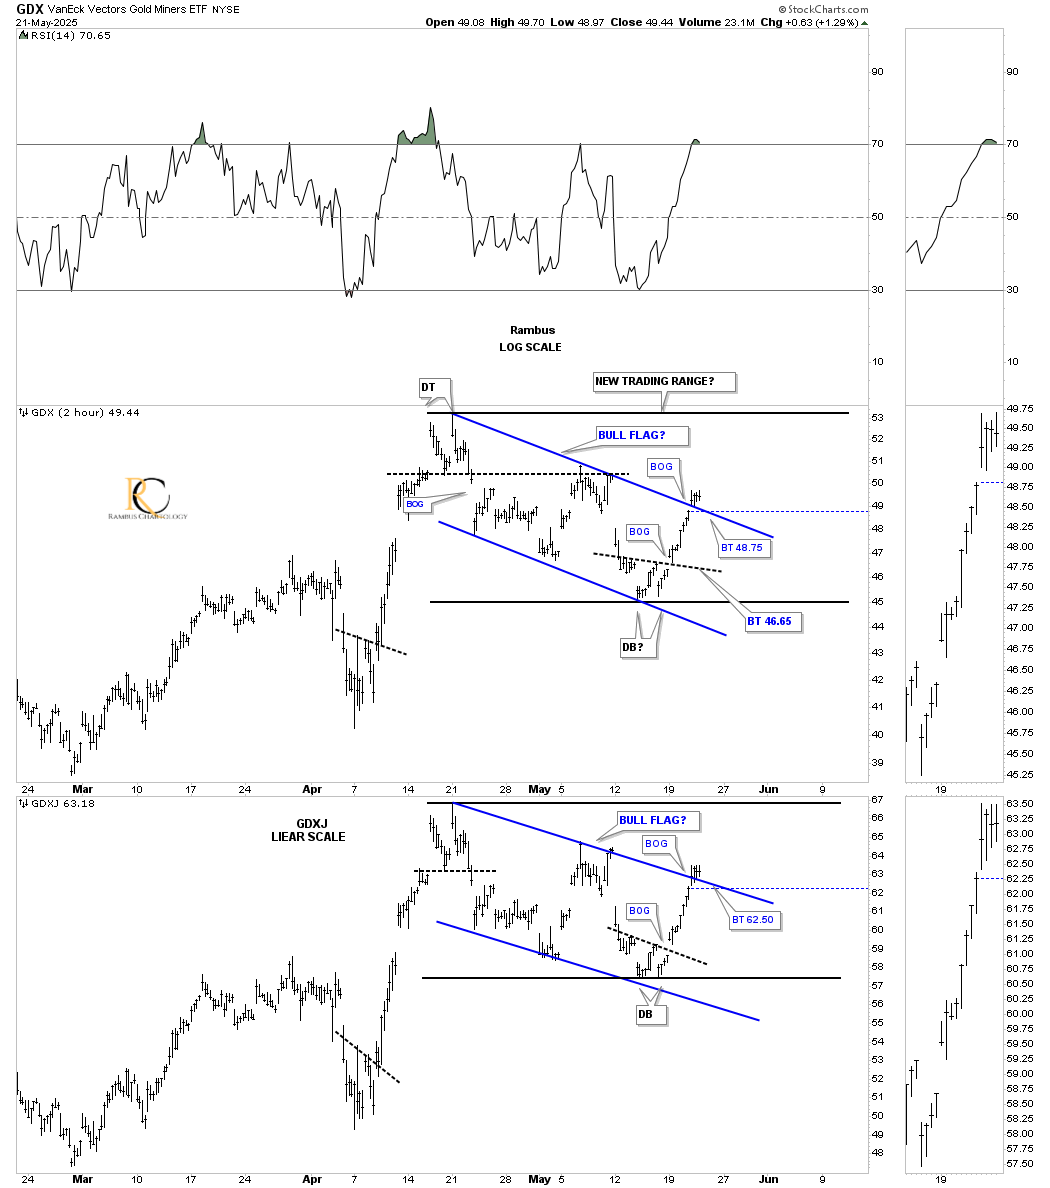
While the HUI doesn’t show gaps, the GDX and GDXJ do, and today both gapped above the top rail of their April bull flag. After a possible backtest, the top of the new trading range will come into focus, at which point we’ll have to see how the price action interacts with the April high. Keep in mind that the April bull flags could very well be a standalone pattern, which we’ll look at in a minute.
Stepping further back in time is the daily chart for the HUI, showing the previous two consolidation patterns: the downtrend channel that formed at the end of 2023 and early 2024, and the bullish falling wedge that formed last fall, bottoming in January of this year.
More By This Author:
Quick Markets Update For Monday, May 19Building For The Next Surge: Consolidation Pattern Analysis
Quick Market Update


Comments
Log in or sign up to join the conversation.