Policy Uncertainty, VIX, 5 Year Breakevens, Dollar Up
Image Source: Unsplash
Since the election:
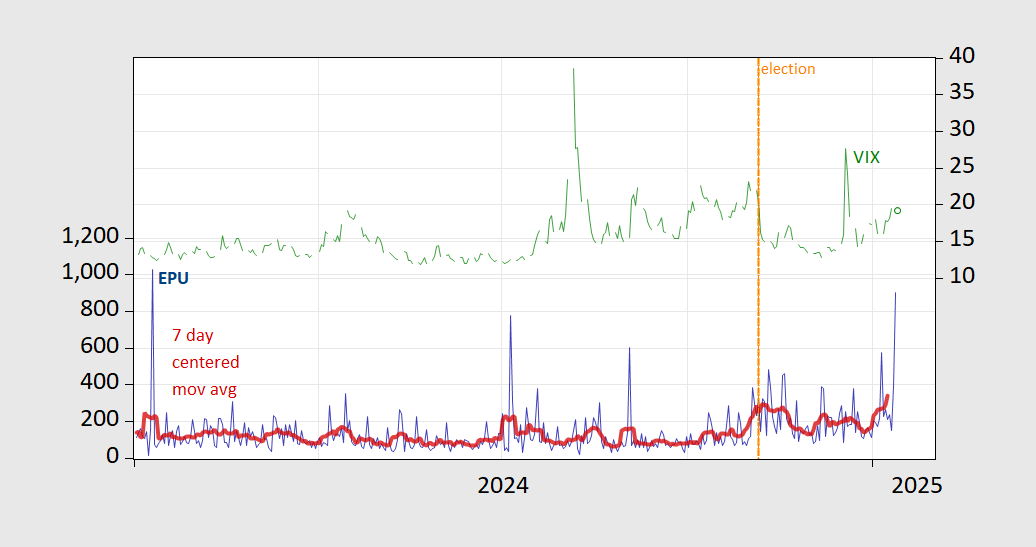
Figure 1: EPU (blue, left scale), 7 day centered moving average (bold red, left scale), VIX (green, right scale). Source: policyuncertainty.com, CBOE via FRED, author’s calculations.
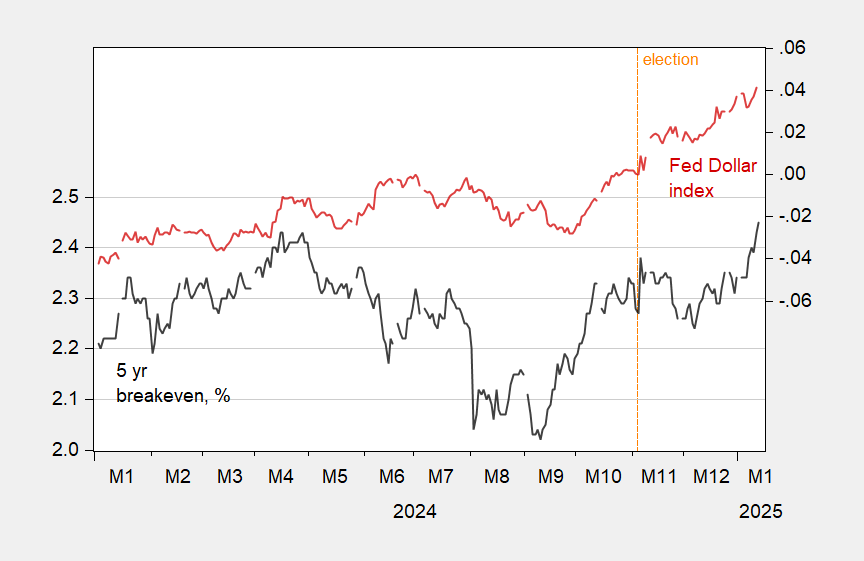
Figure 2: Five year Treasury-TIPS spread, % (black, left scale), log Fed dollar index relative, 11/5/2024 = 0 (red, right scale). Source: Treasury, Federal Reserve via FRED, author’s calculations.
More By This Author:
Inflation Expectations Since The Election: UpSix Measures Of NFP Change Since 2023M12, Four Measures Of Private NFP
Employment In December
Comments
Please wait...
Comment posted successfully
No Thumbs up yet!


