
Given the two-month delay, Thursday’s BLS employment report on September labor market conditions was not nearly as pertinent as the BLS data typically is. Despite it being old news, it is worth sharing that the number of jobs increased by 119k, but the unemployment rate ticked up from 4.3% to 4.4%. The markets didn’t seem to care much about the data, as it’s not likely to sway the Fed into cutting rates or refraining from doing so. While the employment data was stale, there is one lesser-followed component of the report worth elaborating on: permanent job losers. The BLS splits “job losers” into two categories, permanent and temporary. The table below helps appreciate the differences.

Given that the economy has been growing above trend over the last few years, the rising share of permanent job losers in the workforce suggests that layoffs are structural rather than cyclical. Keep in mind that even if a job loss is permanent, if the laid-off person gets a new job, they fall out of the permanent job loser category. As the graph below shows, the number of permanent job losers typically increases rapidly right before or during a recession. Additionally, permanent job losers decline during the economic recovery.
Dissecting the recent increase in permanent job losers yields a few questions worth considering.
- Is the K-shaped economy causing many industries to suffer, thereby permanently reducing headcount?
- Similarly, is AI already resulting in permanent job losses?
- Does the increasing share of permanent job losers portend that a recession is right around the corner?
- Is the increase just a normalization following the erratic labor market in the aftermath of the pandemic?

What To Watch Today
Earnings
- No notable earnings releases
Economy
(Click on image to enlarge)

Market Trading Update
The bullish run of the past few weeks lost its footing as the S&P 500 closed back below its 50-day moving average, ending the week at 6,603. That break is notable. This level, which had previously served as reliable support since the late October low, gave way under broad selling pressure across sectors. Volume picked up on the move lower, and market breadth weakened significantly, with relative strength and breadth remaining very weak. Furthermore, money flows show the shift from accumulation to distribution.
(Click on image to enlarge)

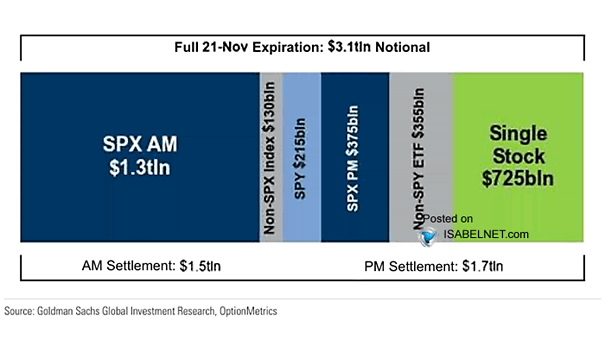
From a technical standpoint, the index broke below the 50-day moving average, a key support level, and fell to the 100-day moving average during Thursday’s market reversal. While there was much speculation about why the market reversed so significantly on Thursday, most of that reversal was likely due to positioning changes ahead of the options expiration on Friday, which was the largest November expiration on record.
While Friday’s strong bounce of the 100-day moving average is encouraging, we are not out of the woods just yet. As noted above, relative strength and breadth continue to be a concern. Should the 100-day moving average not hold, the next area of support sits around the 200-day moving average near 6,163. However, for now, the current pullback remains within a larger bullish structure, but pressure is mounting that should not be dismissed.
Other markets did not escape the selling pressure this past week. The Nasdaq Composite saw downside follow-through, losing nearly 2.75% on the week and closing back below short-term support levels. The AI-related stock basket declined by more than 5%, while Bitcoin fell by almost 10%. Overall, it was a tough week for investors, but the good news is that most markets are now decently oversold, which is enough for a bounce.
We suggest that investors who struggled emotionally during the recent selloff reassess their positioning. If you found the drawdown difficult to handle, take some action:
- Trim Back to Your Risk Tolerance: If the recent decline caused panic or second-guessing, it’s a signal your risk exposure may be too high. Use the bounce to reduce position sizes in volatile or high-beta names. Rebuild your portfolio around positions you can hold through 10–15% corrections without emotional strain. Don’t wait for another leg down to adjust.
- Raise Cash Strategically: Cash is not a missed opportunity — it’s optionality. If you had no flexibility during the decline, use the rally to raise some cash. Trim weaker positions or those that only work in one market scenario. A 10–20% cash allocation gives you the ability to buy future dips rather than sell into fear.
- Reassess Asset Allocation: Market pullbacks test more than individual stock picks — they expose flaws in allocation. Were you too tech-heavy? Too concentrated? Use this bounce to shift into a more balanced mix of growth, value, and defensives. Ensure your exposure isn’t overly reliant on a single theme, such as AI, small caps, or speculative sectors.
- Review Your Exit and Stop Levels: The last two weeks exposed the cost of not having an exit plan. Use this rally to establish or tighten stop-loss levels based on support/resistance — not emotion. Define your max risk per trade or position and write it down. If the market weakens again, you’ll respond with rules, not reactions.
- Document What Went Wrong: Use this bounce as a debrief. What specifically made you uncomfortable during the decline? Was it overexposure, leverage, position sizing, or lack of diversification? Write it out. Then build a checklist for your following trades or allocations. Market stress is unavoidable, but self-inflicted damage can be minimized with better preparation.
This is not the time to chase losses or gamble on full recovery. Use strength to reposition with discipline and clarity. Let the market work for you, not against your temperament.
The Week Ahead
This will be a quiet week as Wall Street takes a break for the Thanksgiving Holiday. In addition to Thursday’s closure, stocks and bonds will also close early at 1 pm ET on Friday. Of note this week will be the weekly ADP number and September’s retail sales and PPI reports. All three reports will come on Tuesday. Like the employment data last week, we are not sure how much the market will care about stale inflation and retail sales data. We suspect that ADP will continue to show no job growth.
Capex Spending On AI Masks Economic Weakness
The U.S. economy’s recent growth has a distinctive engine: large‑scale capital expenditures (capex) tied to artificial intelligence (AI). Firms such as Microsoft, Alphabet (Google), Meta Platforms, and Amazon have announced massive investments in data centers, servers, networking equipment, and AI infrastructure. As noted by Investing.com:
“Artificial intelligence is consuming capital faster than investors can recalibrate. Bank of America now sees global hyperscale spending rising 67% in 2025 and another 31% in 2026, with total outlays climbing to $611 billion. That is a $145 billion increase in just one month’s estimates.
The surge shows how cloud giants are doubling down. Google raised its 2025 capital budget to $92 billion, Microsoft plans even faster growth into fiscal 2026, and Meta now expects spending of about $100 billion in 2026. Amazon’s data center capacity is on track to double by 2027. None show intent to slow down, even as capex intensity approaches 30% of sales, roughly triple historic norms.
That level of investment is extraordinary. At its peak, the 5G telecom buildout consumed about 70% of operating cash flow, AI infrastructure is now approaching the same strain.

While we can certainly discuss the magnitude of those investments and the risks associated with repeating another “Dot.com” overbuild, the point I want to address with you today is how those capital expenditures are masking broader economic weakness.
Tweet of the Day

More By This Author:
Market Bubbles: A Rational Guide To An Irrational MarketThe AI Trade: Opportunity Or Warning?
Capex Spending On AI Is Masking Economic Weakness


Comments
Log in or sign up to join the conversation.