Pedigreed Dividend Dogs (5-50 Annual Raises) Show Cash To Cover Dividends
Summary
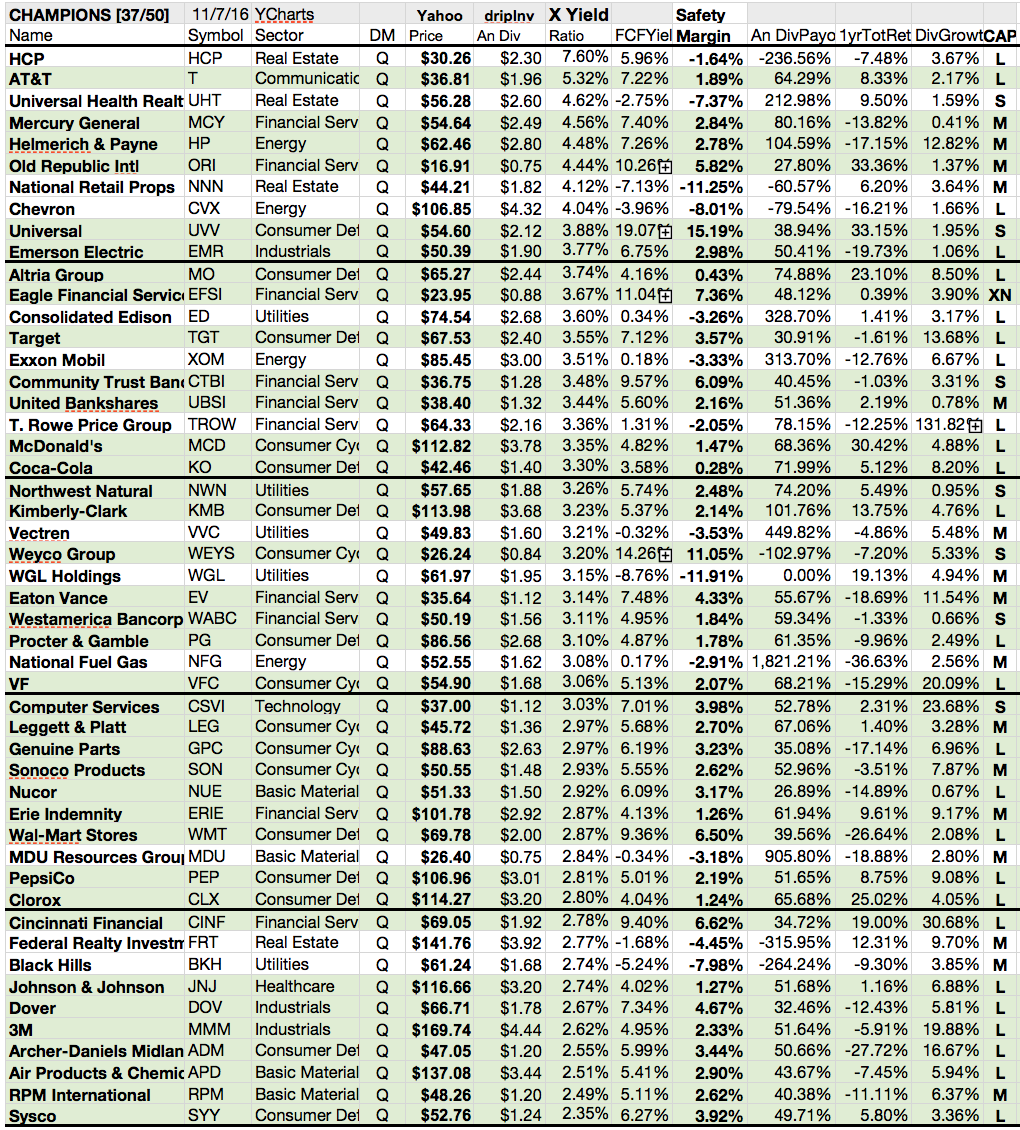
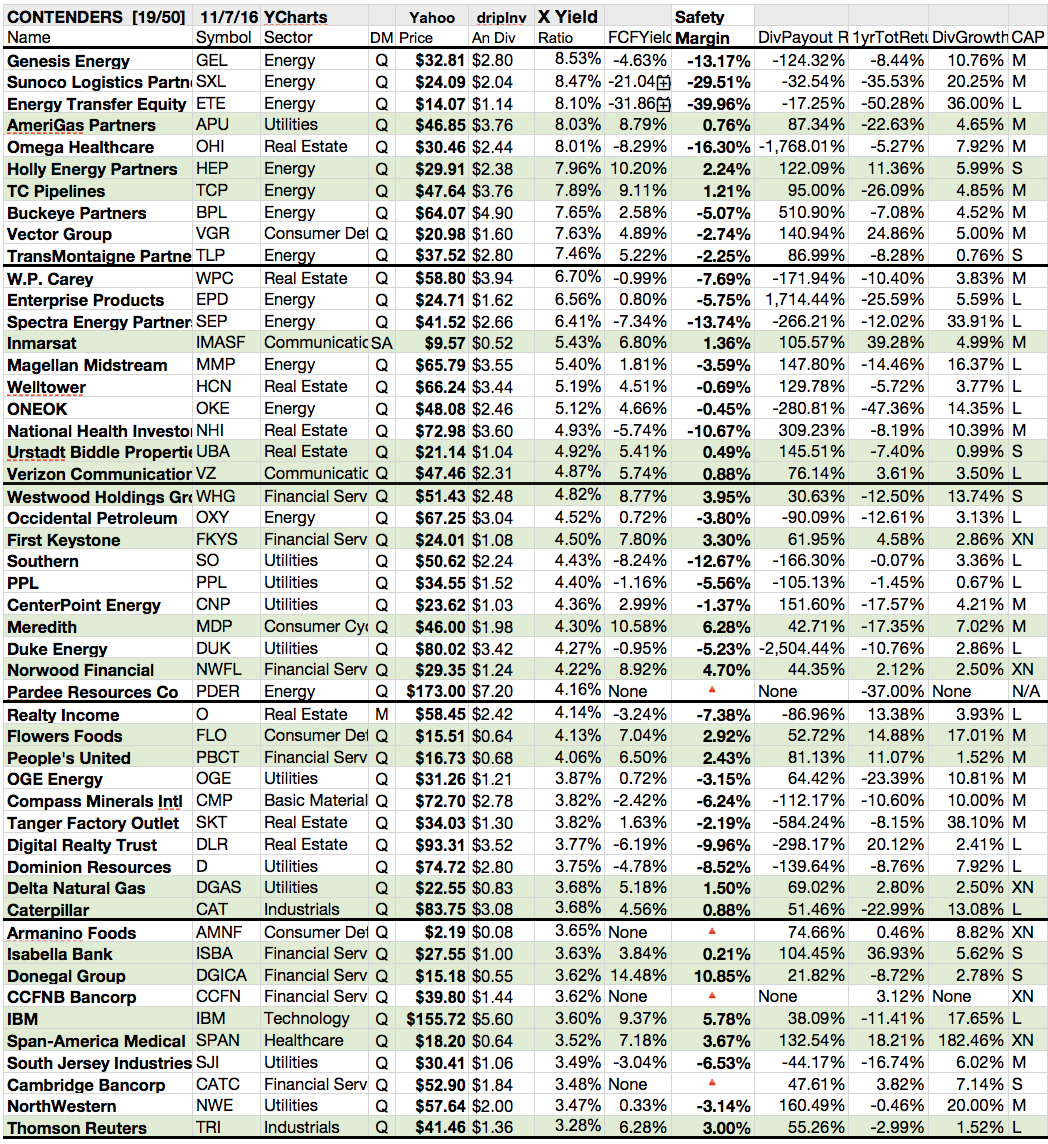
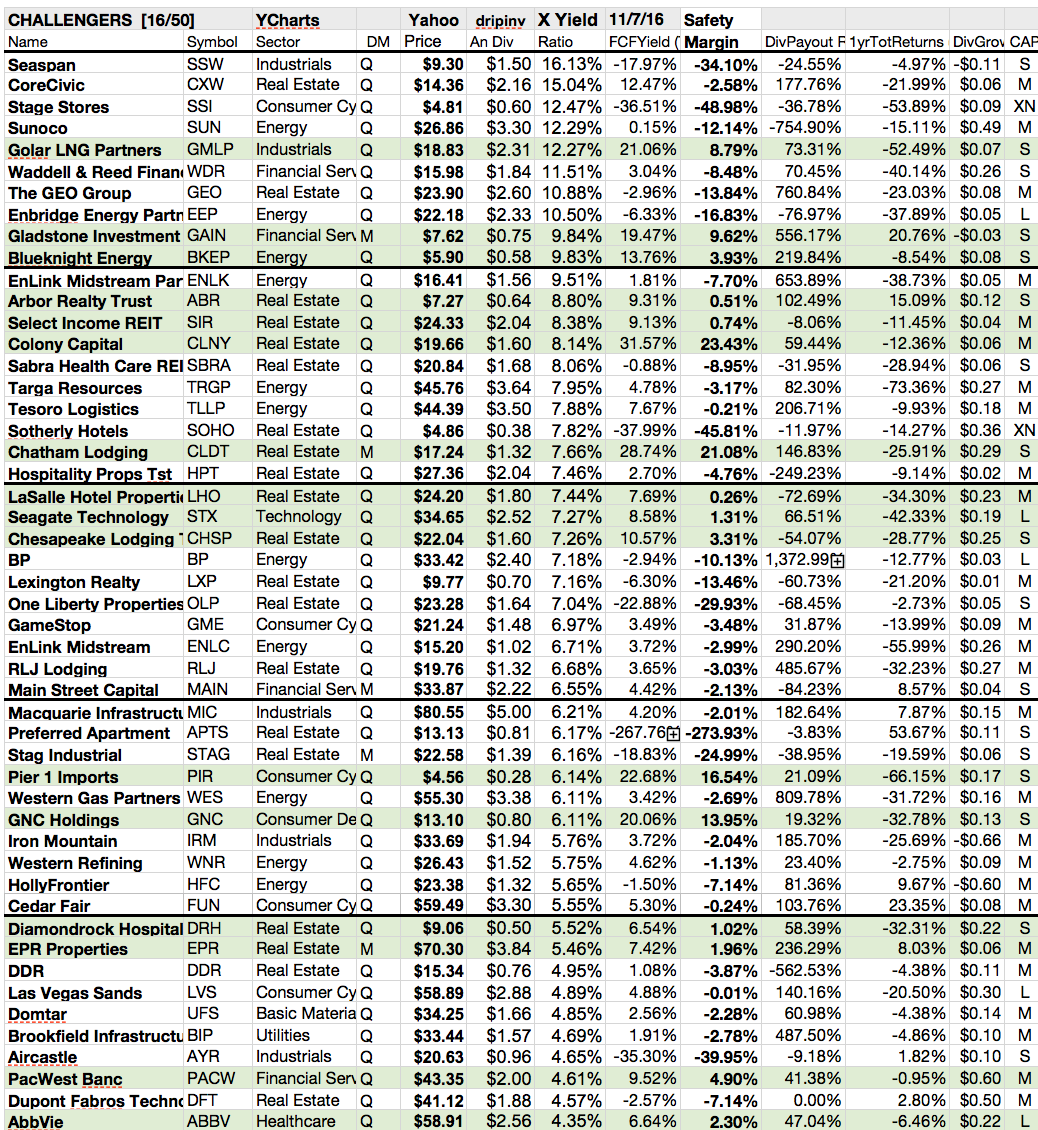
Despite their five to fifty year records of dividend increases, not all dividend Champion (25+), Contenders (10-24), and Challenger (5-9) dogs show safe margins of cashflow to sustain their payouts.
72 of 150 Dividend Champion Contender & Challenger (CCC) dogs pay dividends deemed safe because their free cash flow yield exceeds dividend yield. These 72 have margin to cover anticipated dividends.
Safe Champions, CTBI; TGT; EFSI; MO; EMR; UVV; ORI; HP; MCI; T yields ranged 3.48%-5.32%. Safe Contenders, NWFL; MDP; FKYS; WHG; VZ; UBA; IMASF; TCP; HEP; APU yields ranged 4.22%-8.03%. Challengers, CHSP; STX; LHO; CLDT;CLNY; SIR; ABR; BKEP; GAIN; GMLP yields were 7.26%-12.27%.
Besides safety margin, CCC dogs were also screened for payout ratios, total annual returns, and dividend growth as of November 7 market close, to further gauge dividend reliability.
Brokers credited 5 top yield safe Champion dogs with 99.08% more, Contender dogs with 9.58% LESS, and Challenger dogs with 14.41% more gains from $5k invested in the lowest priced five than from $5K invested in ten.
The Dividend Dogs Rule
The "dog" moniker was earned by stocks exhibiting three traits: (1) paying reliable, repeating dividends, (2) their prices fell to where (3) yield (dividend/price) grew higher than their peers. Thus, the highest yielding stocks in any collection became known as "dogs."

MPCOCHASA [0] 3PupsPic; NO16 funny-pictures.picphotos.net
Do CCC "Safe" Dogs Cover All Sectors?
The top 30 of 72safe CCC Dogs came from 9 of 11 business sectors. These were: communication services (3); financial services (8); energy (4); consumer defensive (3); industrial (2); utilities (1); real estate (7); consumer cyclical (1); technology (1). Two sectors were not represented:healthcare; basic materials.
74 of 150 Dividend Champion, Contender & Challenger Dogs Have Cash Margins to Cover Dividends
(Click on image to enlarge)
(Click on image to enlarge)
(Click on image to enlarge)
Periodic Safety Check
Three previous articles discussed the attributes of these 150 Champion, Contender & Challenger dividend dogs from which these "safest" were sorted. You see above the green tinted list that passed the dividend "stress" test. These 72 Dividend CCC dogs report sufficient annual cash flow yield to cover their anticipated annual dividend yield. The margin of excess is shown in the boldface "Safety Margin" column.
(Click on image to enlarge)
(Click on image to enlarge)
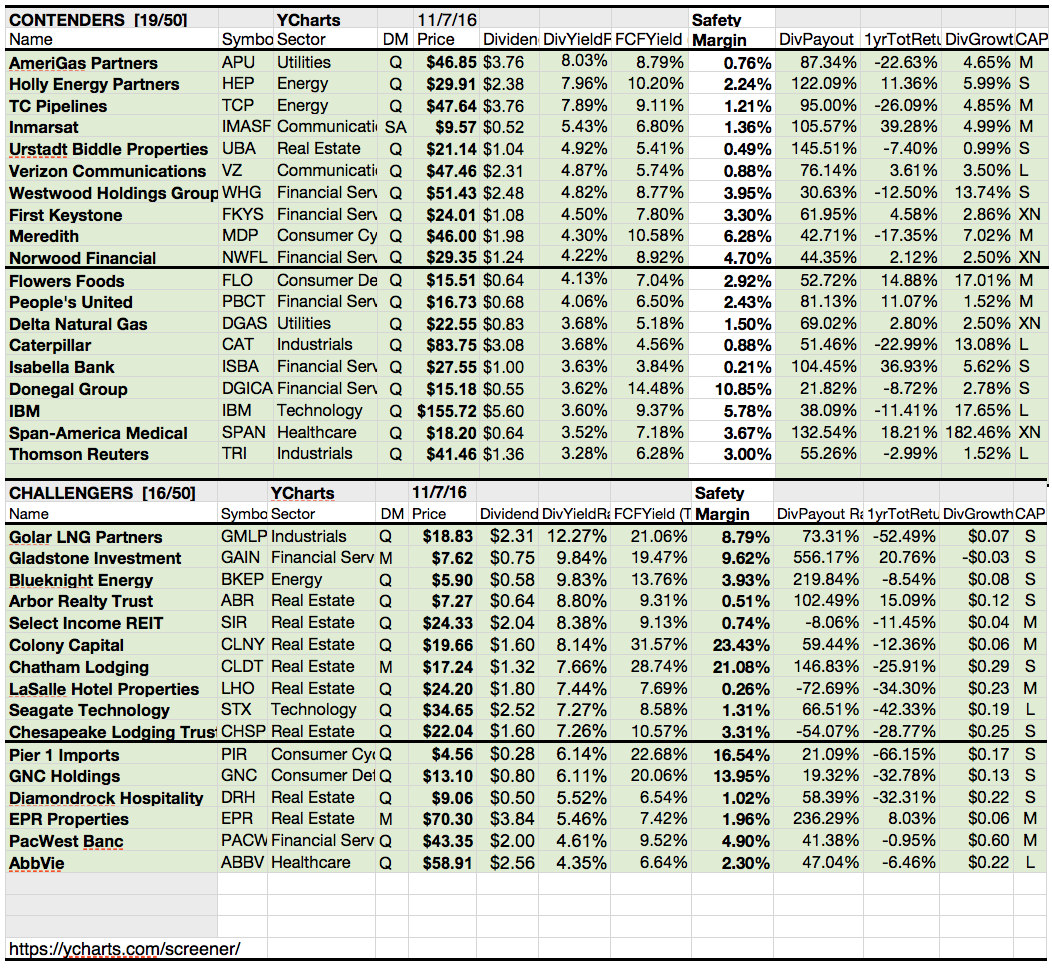
Financial guarantees however are easily over-ruled by a cranky board of directors or company policy canceling or varying the payout of dividends to shareholders. This article asserts that wherewithal in the form of cash flow yield is a strong reason to sustain a track record of annual dividend hikes.
The safe Challengers carry pedigrees of 5 to 9 annual dividend increases. Safe Contenders have demonstrated 10 to 24 such increases, and safe Champions claim 25+ annual increases.
Actionable Conclusions: (1) Ten Top Safe CCC Dogs Showed 19.37% Average Upside, While (2) Four Dropped Down -2.45% To -11.24% Estimated For November 2017
(Click on image to enlarge)
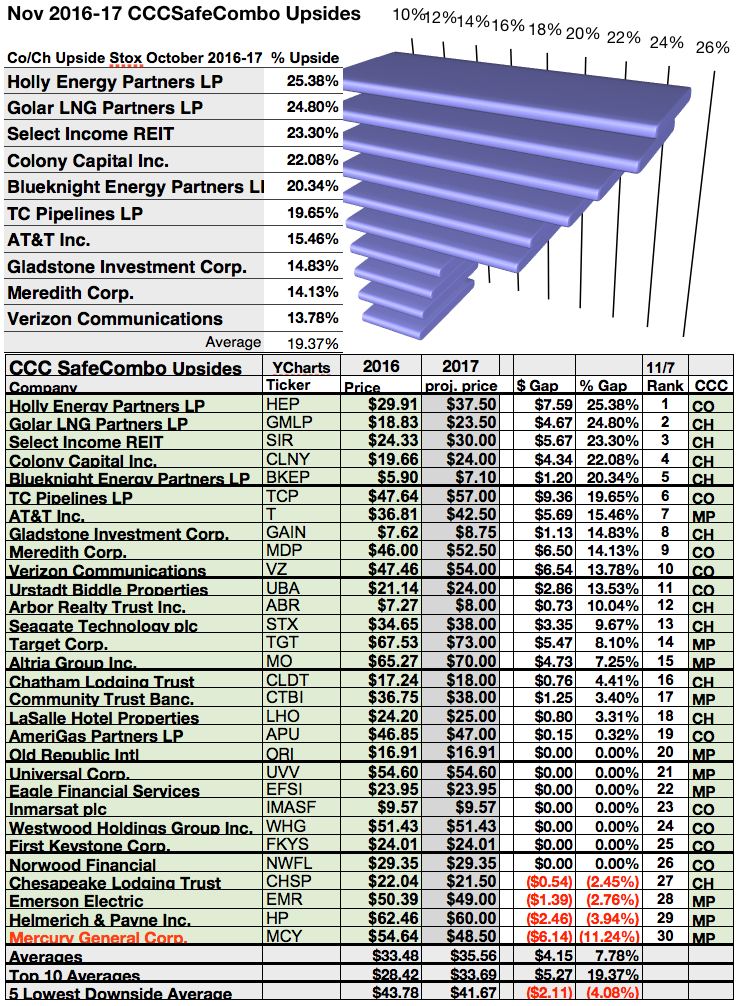
To quantify top dog rankings, analyst mean price target estimates provided a "market sentiment" gauge of upside potential. Added to the simple high yield "dog" metrics, analyst mean price target estimates were another tool used to dig out bargains.
Actionable Conclusions: Wall St. Wizards Forecast (3) 7.78% Upside & (4) 12.14% Net Gain Averages From 30 Safe Dividend CCCs By November 2017
(Click on image to enlarge)
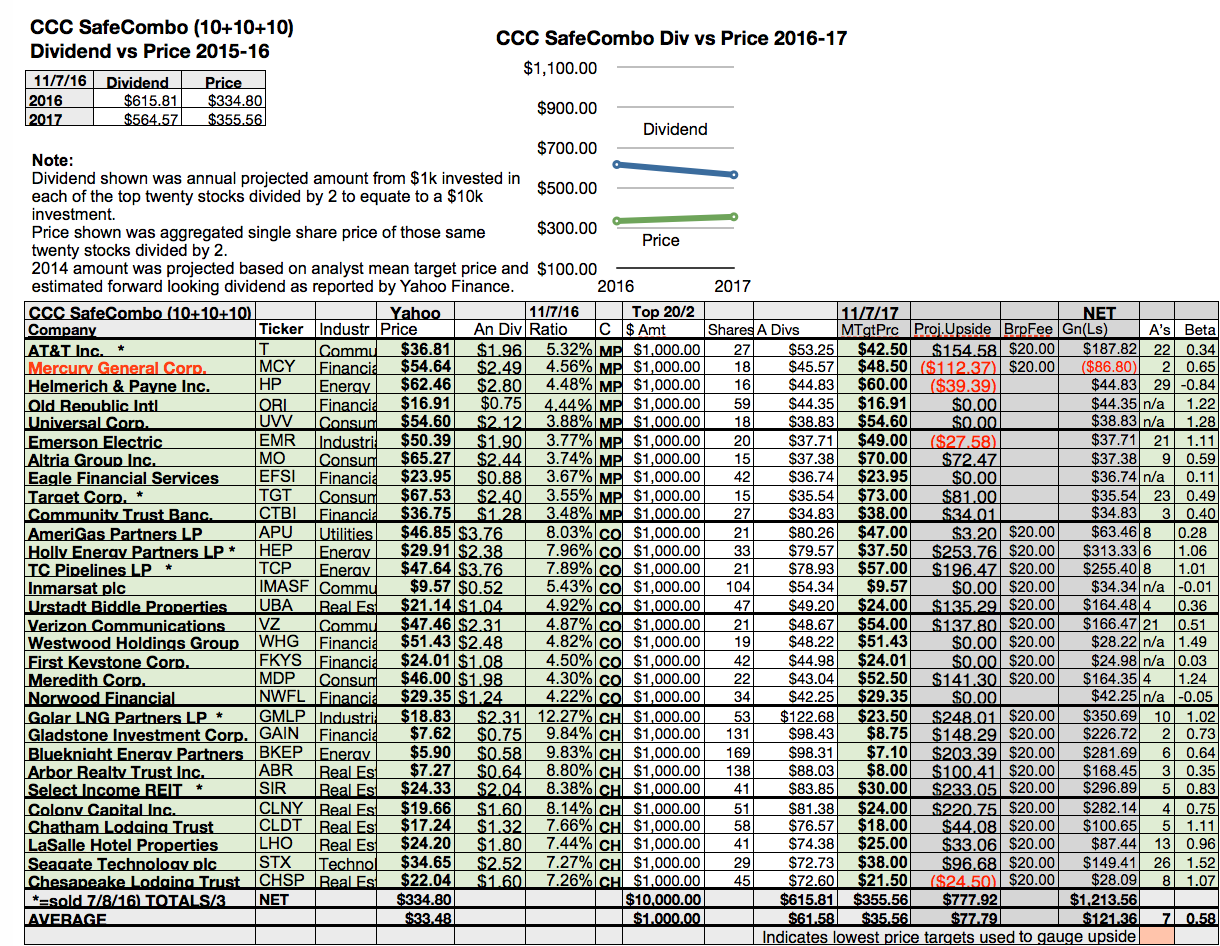
Thirty safe dogs from David Fish's Dividend Champions, Contenders & Challengers lists were graphed above as of November 7, 2016, and compared to analyst mean price target estimates for the same date in 2017.
A hypothetical $1000 investment in each equity was divided by the current share price to find the number of shares purchased. The shares number was then multiplied by predicted annual dividend amounts to find the return.
Historic prices and actual dividends paid from $30,000 invested as $1k in each of the highest-yielding stocks and the aggregate single share prices of those thirty stocks divided by 3 created data points for 2016. Projections based on estimated increases in dividend amounts from $1000 invested in the thirty highest yielding stocks and aggregate one-year analyst target share prices from Yahoo Finance divided by 3 created the 2017 data points in green for price and blue for dividend.
Analyst data reported by Yahoo finance projected an 8.3% lower dividend from $30K invested as $1k in each stock in this group while aggregate single share price was projected to increase 6.2% in the coming year.
The number of analysts contributing to the mean target price estimate for each stock was noted in the next to the last column on the charts. Three to nine analysts had a better history of accurate estimates.
A beta (risk) ranking for each analyst rated stock was provided in the far right column on the above chart. A beta of 1 meant the stock's price would move with the market. Less than 1 showed lower than market movement. Higher than 1 showed greater than market movement. A negative beta number indicated the degree of a stock price movement opposite of market direction.
Actionable Conclusion (5): Analysts Predict Top Ten Safe Dividend CCC Dogs To Net 6.87% to 42.76% By November 2017
Ten probable profit generating trades were revealed by Thomson/First Call in Yahoo Finance into 2017:
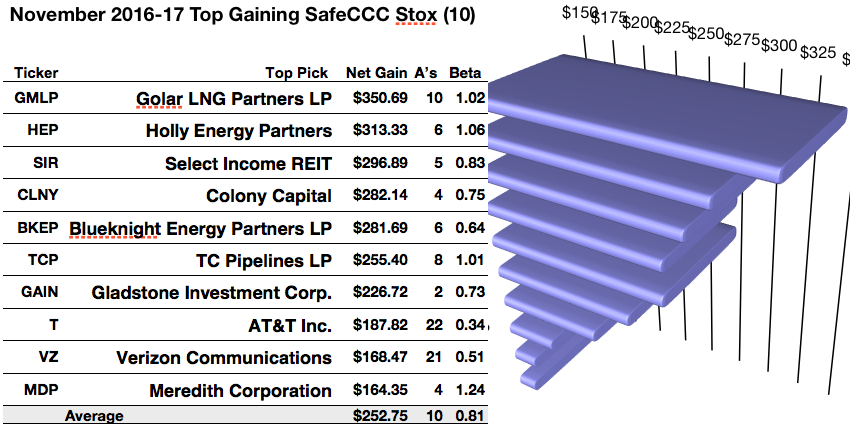
Golar LNG Partners LP (GMLP) (a Challenger) was projected to net $350.69 based on dividends plus median target price estimate from ten analysts less broker fees. The Beta number showed this estimate subject to volatility 2% more than the market as a whole.
Holly Energy Partners (HEP) (a Contender) was projected to net $313.33 based on dividends plus the lowest of annual price estimates from six analysts less broker fees. The Beta number showed this estimate subject to volatility 6% more than the market as a whole.
Select Income REIT (SIR) (a Challenger) was projected to net $296.89 based on dividends plus the median rates of five analysts less broker fees. The Beta number showed this estimate subject to volatility 17% less than the market as a whole.
Colony Capital (CLNY) (a Challenger) was projected to net $282.14 based on dividends plus the annual price estimate from four analysts less broker fees. The Beta number showed this estimate subject to volatility 25% less than the market as a whole.
Blueknight Energy Partners LP (BKEP) (a Challenger) was projected to net $281.69 based on dividends plus the median target price estimate from six analysts less broker fees. The Beta number showed this estimate subject to volatility 36% less than the market as a whole.
TC Pipelines LP(TCP) (a Contender) was projected to net $255.40 based on a median target price estimate from eight analysts combined with projected annual dividend less broker fees. The Beta number showed this estimate subject to volatility 1% more than the market as a whole.
Gladstone Investment Corp. (GAIN) (a Challenger)was projected to net $226.72 based on a median target price estimate from two analysts combined with projected annual dividend less broker fees. The Beta number showed this estimate subject to volatility 27% less than the market as a whole.
AT&T Inc. (T) (a Champion) was projected to net $140.31 based on dividends plus median target price estimate from twenty-two analysts less broker fees. The Beta showed this estimate subject to volatility 66% less than the market as a whole.
Verizon Communications (VZ) (a Contender) was projected to net $168.47 based on dividends plus the median of annual price estimates from twenty-one analysts less broker fees. The Beta number showed this estimate subject to volatility 49% less than the market as a whole.
Meredith Corporation (MDP) (a Contender) was projected to net $164.35 based on a median target price estimate from four analysts combined with dividends less broker fees. The Beta number showed this estimate subject to volatility 24% more than the market as a whole.
The average net gain in dividend and price was 25.28% on $10k invested as $1k in each of these ten dogs. This gain estimate was subject to average volatility 19% less than the market as a whole.
Actionable Conclusion (6): (Bear Alert) Analysts Asserted One Safe Champion Dog Showed A Loss Of 8.6% By 2017
Probable losing trades revealed by Thomson/First Call in Yahoo Finance in 2017 were:

Mercury General Corp. (MCY) was projected to lose $86.00 based on dividend and a median target price estimate from two analysts including $20 of broker fees. The Beta number showed this estimate subject to volatility 35% less than the market as a whole.
Actionable Conclusion (7): "If Everyone Told The Truth, The Market Would Not Move:" HEP vs. MCY Price History
(Click on image to enlarge)
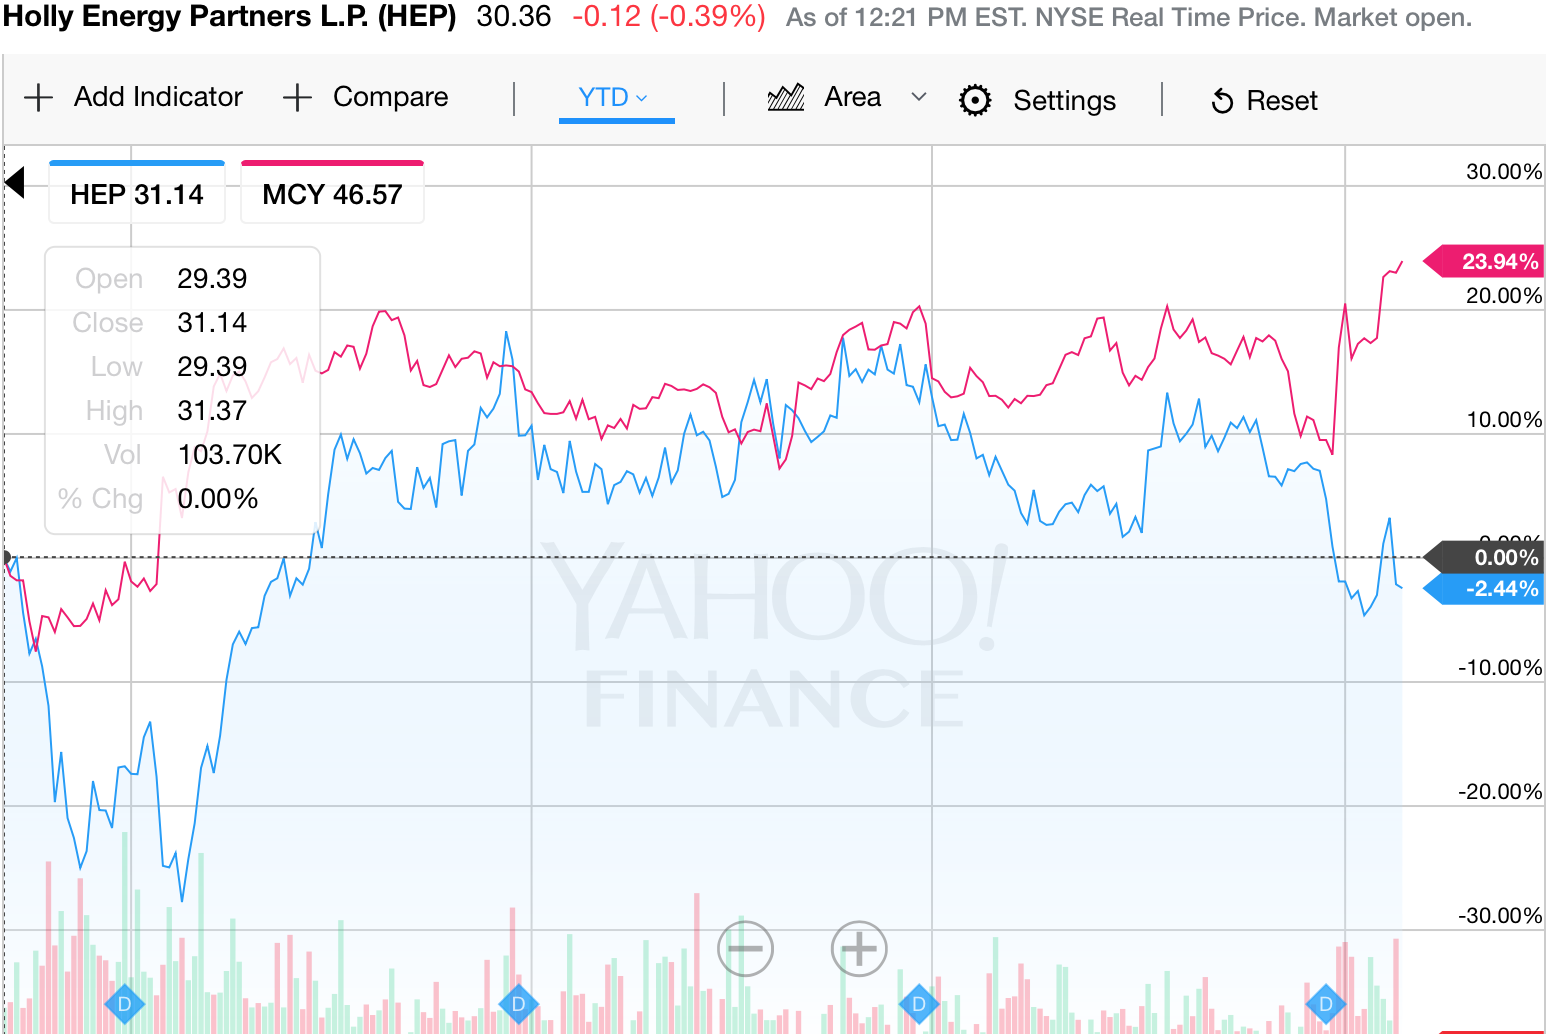
Year to date price performance of Mercury General Corp. (MCY) the Contenderportfolio "loser" red-lined by analysts, showed healthy 23.94% upside in contrast to the modest -2.44% negative price history demonstrated by analyst tagged upside leader, Holly Energy Partners LP(HEP).
Momentum contradicted these two analyst projections.
Dog Metrics Looked For Small Dog Bargains
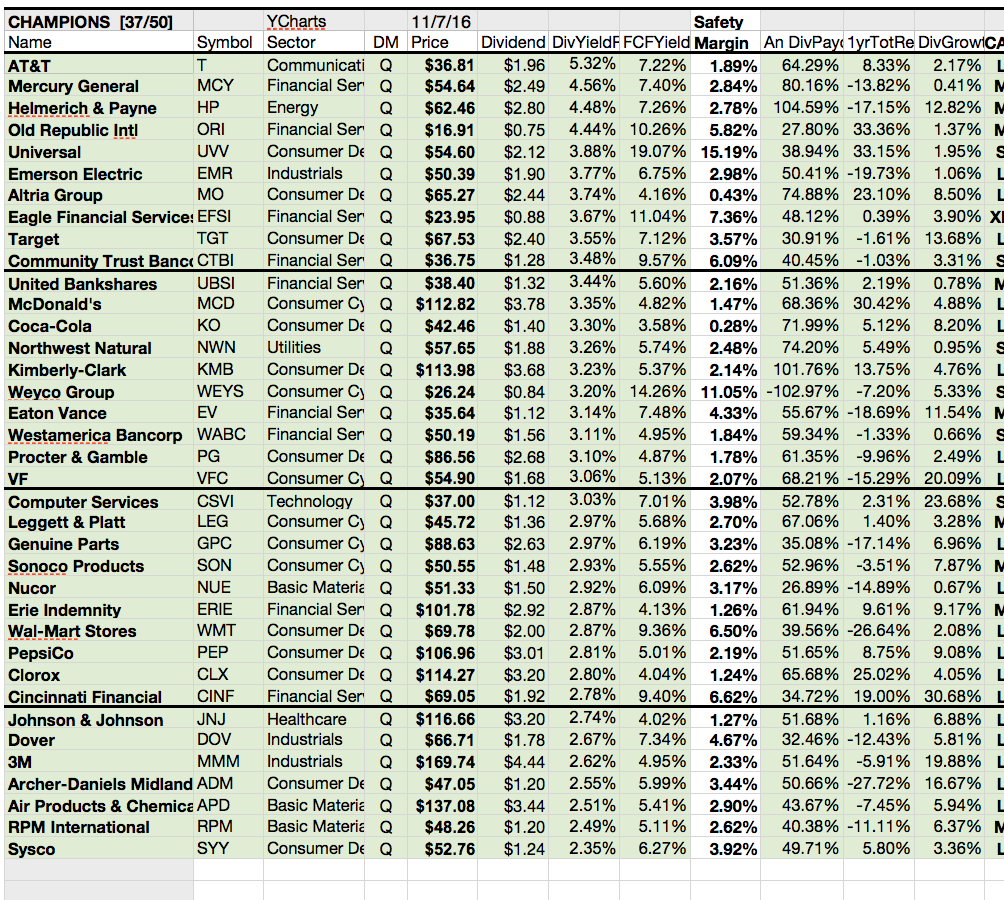
Dog Metrics Sorted "Safe" Champion Stocks
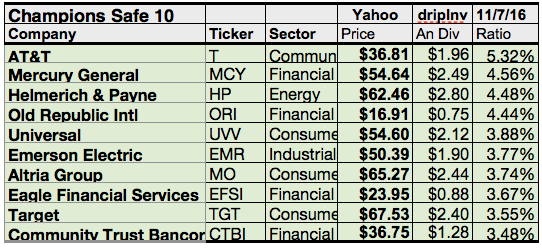
Ten "Safest" top Champions displaying the biggest yields November 7 per YChart data ranked themselves by yield as follows:
Actionable Conclusion: Analysts Calculated Five Lowest Priced of "Safe" Ten Top Yield Champion Dogs To Deliver 8.84% VS. (2) 4.44% Net Gains from All Ten by November, 2017
(Click on image to enlarge)
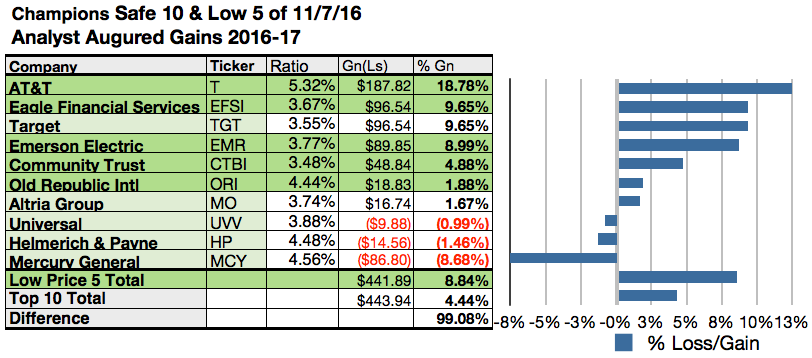
$5000 invested as $1k in each of the five lowest priced stocks in the 10 highest yield safe Champion dog kennel by yield were determined by analyst one-year targets to deliver 99.08% more net gain than $5,000 invested as $.5k in all ten. The fourth lowest priced Champion dog, AT&T Inc. (T) showed the top estimated net gain of 18.78% per analyst targets.
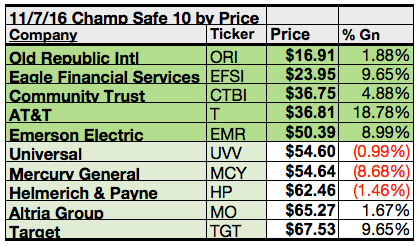
Lowest priced five "safe" Champion dogs as of November 7 were: Old Republic International (ORI), Eagle Financial Services (EFSI); Community Trust Bancorp (CTBI), AT&T Inc., Emerson Electric (EMR), with prices ranging from $16.91 to $50.39.
Higher priced five Safe Champion dogs as of November 7 were: Universal (UVV),Mercury General (MCY), Helmerich & Payne (HP), Altria Group (MO), and Target (TGT), whose prices ranged from $54.60 to $67.53.
Dog Metrics Rated "Safe" Contender Stocks
Ten "Safest" top Contenders that displayed the biggest yields November 7 per YChart data ranked themselves by yield as follows:
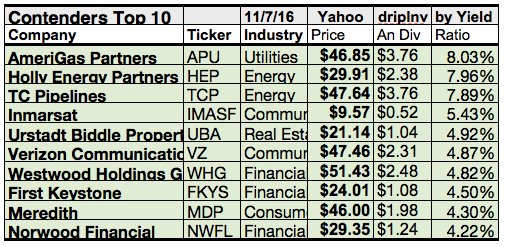
Actionable Conclusion: Analysts Estimated Five Lowest Priced of "Safe" Ten Top Yield Contender Dogs To Deliver 11.19% VS. (2) 12.37% Net Gains from All Ten by November, 2017
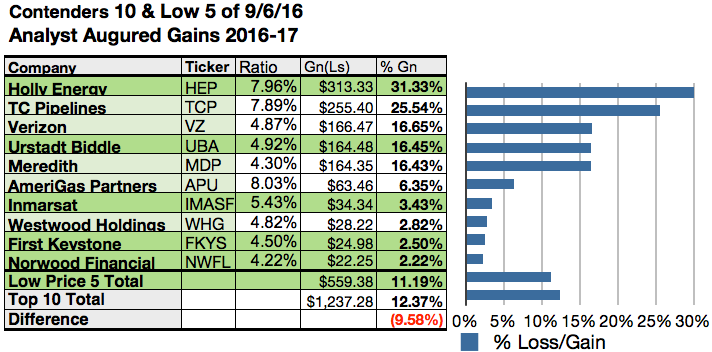
$5000 invested as $1k in each of the five lowest priced stocks in the 10 highest yield safe Contender dog kennel by yield were determined by analyst one-year targets to deliver 9.58% LESS net gain than $5,000 invested as $.5k in all ten. The fifth lowest priced Contender dog, Holly Energy Partners (HEP) showed the top estimated net gain of 31.33% per analyst targets.
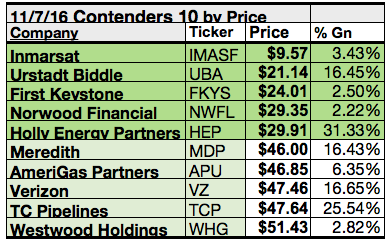
Lowest priced five "safe" Contender dogs as of November 7 were: Inmarsat (IMASF), Urstadt Biddle Properties (UBA), First Keystone (FKYS), Norwood Financial (NWFL); Holly Energy Partners (HEP), with prices ranging from $9.57 to $29.91.
Higher priced five Safe Contender dogs as of November 7 were: Meredith (MDP),AmeriGas Partners (APU), Verizon Communications (VZ), TC Pipelines (TCP), and Westwood Holdings Group (WHG), whose prices ranged from $46.00 to $51.43.
Dog Metrics Selected "Safe" Challenger Stocks
Ten "Safest" top Challenger issues that showed the biggest yields November 7 per YCharts data ranked themselves by yield as follows:
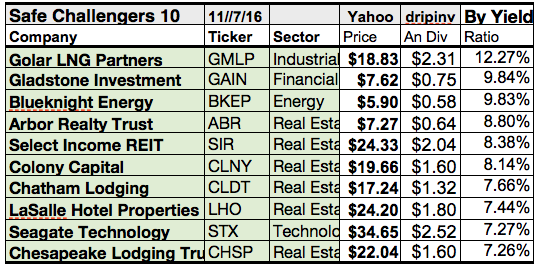
Actionable Conclusions: (1) Analysts Estimated Five Lowest Priced of "Safe" Ten Top Yield Challenger Dogs To Deliver 22.56% VS. (2) 19.72% Net Gains from All Ten by November, 2017
(Click on image to enlarge)
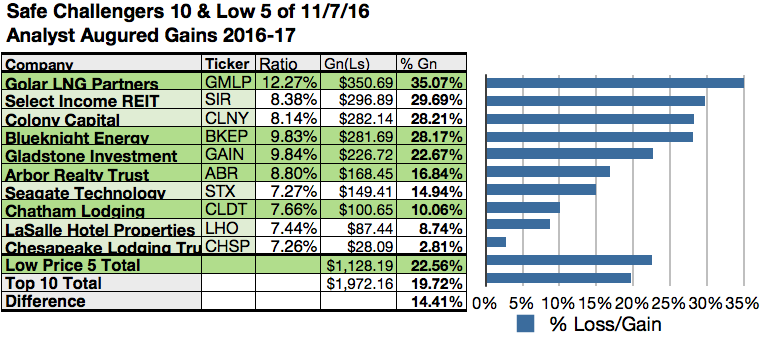
$5000 invested as $1k in each of the five lowest priced stocks in the 10 highest yield safe Challenger dog kennel by yield were determined by analyst one-year targets to deliver 14.41% more net gain than $5,000 invested as $.5k in all ten. The fifth lowest priced Challenger dog, Golar LNG Partner (GMLP) showed the top estimated net gain of 35.07% per analyst targets.
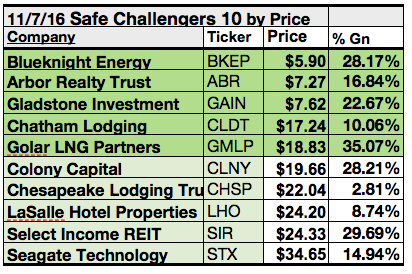
Lowest priced five "safe" Challenger dogs as of November 7 were: Blueknight Energy (BKEP), Arbor Realty Trust (ABR), Gladstone Investment (GAIN), Chatham Lodging (CLDT); Golar LNG Partners (GMLP), with prices ranging from $5.90 to $18.83.
Higher priced five Safe Challenger dogs as of November 7 were: Colony Capital (CLNY),Chesapeake Lodging Trust (CHSP), LaSalle Hotel Properties (LHO), Select Income REIT (SIR), and Seagate Technology (STX), whose prices ranged from $19.66 to $34.65.
This distinction between five low priced dividend dogs and the general field of 10 reflects the "basic method" Michael B. O'Higgins employed for beating the Dow. The added scale of projected gains based on analyst targets contributed a unique element of "market sentiment" gauging upside potential. It provided a here and now equivalent of waiting a year to find out what might happen in the market. Its also the work analysts got paid big bucks to do.
Caution is advised, however, as analysts are historically 20% to 80% accurate on the direction of change and about 0% to 20% accurate on the degree of the change.
The net gain estimates mentioned above did not factor in any foreign or domestic tax problems resulting from distributions. Consult your tax advisor regarding the source and consequences of "dividends" from any investment.
Disclosure: Stocks listed above were suggested only as possible starting points for your ...
more


Great dividend dogs list here, thanks.
Full lists of these dogs are found at: http://www.dripinvesting.org/Tools/Tools.asp
Thanks, Fredrik, but the link doesn't seem to work.
Not sure why it would fail for you. Try another browser?