
Today’s news about Peloton (PTON) gave me the proper mental image to define the market’s recent activity. No, it’s not that the stock is down about 7% after recalling 2.2 million bikes, it’s that the S&P 500 Index (SPX) has gone largely nowhere for the quarter-to-date — over a month — despite the hard work put in by traders.
SPX ended the month of March at 4,109.31 after a 1.44% jump on the last day of the quarter. As we type this at 11 AM EDT, SPX is at 4,122.40. That’s a hardly robust 0.32% gain in just under six weeks. With mega-cap tech stocks leading the way, thanks in part to enthusiasm about the promise of artificial intelligence (AI), we expected some outperformance from the NASDAQ 100 Index (NDX). That was indeed the case but in a barely meaningful way. Over that period, NDX rose from 13,181.35 to a current 13,362.19, a gain of 1.4%. Furthermore, as the graph below shows, much of NDX’s outperformance has come in the past week:
Quarter-to-Date Chart, SPX (red/green hourly bars), NDX (blue line), with Horizontal Line at Prior Quarter’s Close
(Click on image to enlarge)
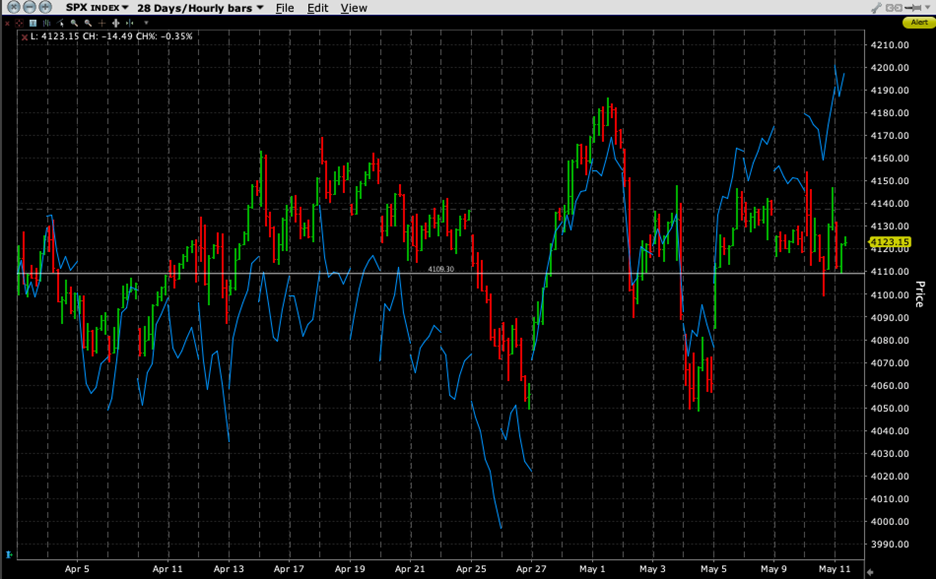
Source: Interactive Brokers
As we can see above, it’s not as though the ranges have been particularly wide either.SPX’s high for the quarter, which was touched on the first of this month, was 4,186.92. The low, which was reached three days later, was 4,048.28, meaning the range for the quarter (and month) is about 3.4%.
Bearing that in mind, it is hardly surprising that the Cboe Volatility Index (VIX) is mired in the high teens. We have noted that VIX seems relatively sanguine, seemingly mired at relatively low levels, even as concerns about a default stemming from the debt ceiling could come to a head during the 23-37 day period measured by VIX. But volatility traders frequently use the past as a prologue, and historical volatilities give traders little reason to bid aggressively for protection right now.
Implied volatility for one-month at-money SPX options is currently in the 14-15 range. That is in line with the 100-day historical volatility, and well above the levels of 30-day and 10-day historical volatility, which measure 10.3% and 11.5% respectively.
SPX Volatilities, Implied (white, right scale), 10-Day (yellow, right), 30-Day (orange, right), 100-Day Historical (magenta, right), vs. SPX (light gray, left)
(Click on image to enlarge)
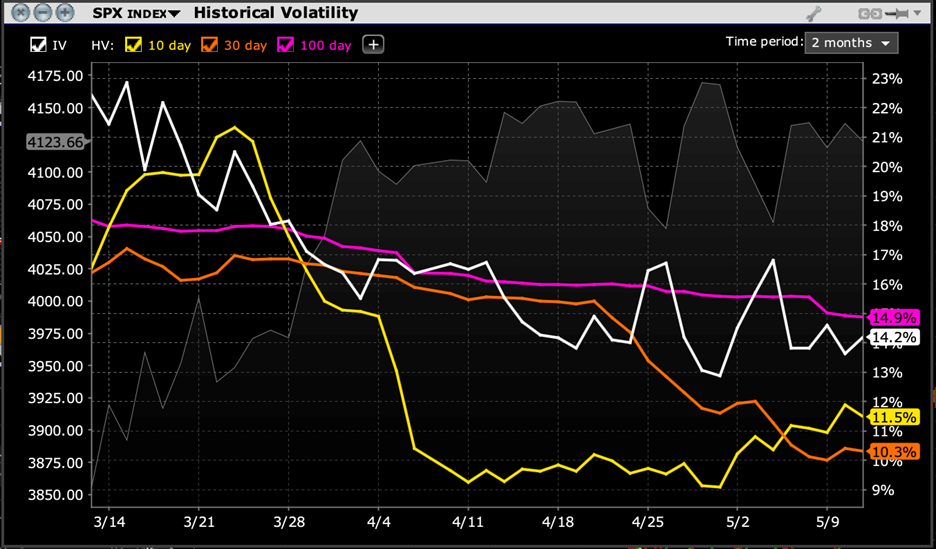
Source: Interactive Brokers
The bottom line is this: despite the relatively low levels of VIX and SPX implied volatility, traders are actually pricing in some modest risk aversion. Whether or not this seems appropriate depends upon your perception of future events. If you’re concerned that the debt ceiling stalemate will lead to increased volatility, then it is reasonable to think that SPX implied volatility is on the low side. The same is true if you expect the proverbial “sell in May” to kick in soon. However, if you believe that we will remain mired in the tight range that has prevailed so far this quarter, then VIX and SPX implied volatility seems expensive. Calibrate your expectations accordingly.
More By This Author:
Markets Inch Cautiously Higher On Improved Inflation Comps
Don’t Fire Until You See The Whites Of Their Eyes
Yields Pop As Fiery Jobs Report Justifies Powell


Comments
Log in or sign up to join the conversation.