Panic Selling At All-Time Highs – What It Means
On Wednesday I wrote about runaway momentum and how it crushes everything in its way until it doesn’t. That very day and without notice, stocks saw a nasty downside reversal in matter of minutes that turned to hours. Some in the media made a federal case about it. I even heard one interviewer ask a guest to comment on the importance of the last 20 MINUTES. Come on. 20 minutes? Are we next going to discuss minute-to-minute trading?
Wednesday’s action was a warning shot of things to come which I know sounds odd coming from me. After all, so many people ask me if I am ever bearish. Faithful readers know that answer is a definitive yes. And while I am not bearish just yet, or even titling that way, I do see storm clouds building for Q1 2024.
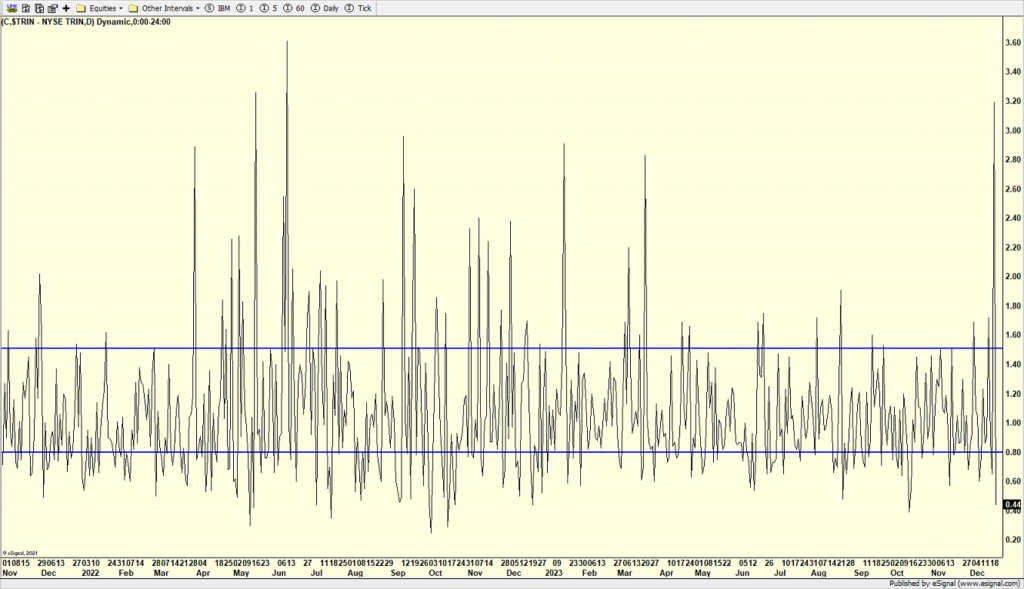
Wednesday was one of those “all in” days where 90% of the volume was in stocks going down. A few indicators I watch registered complete and utter panic at levels typically seen at the end of large declines. The Arms Index or TRIN is one of them. 3.21. I won’t get wonky on you but this indicator usually traffics between .80 and 1.50. We haven’t seen a 3 handle since the collapse in June 2022 when the S&P 500 was down more than 20%. It’s more than a bit odd we saw panic type selling on the same day as an all-time high.
(Click on image to enlarge)

It really doesn’t matter why it happened, only that it did. Lots of folks are blaming the recently created zero day options which are derivatives that expire the same day. On the surface they are the ultimate in gambling and seemingly for the mom and pop speculator. In reality, big money has been playing these for some time and a whole new market has been created with lines in the sand drawn each day where accelerated buying or selling takes place.
Wednesday’s reversal was dramatic and can be seen at major turning points. I don’t think this is the case. The Dow, S&P 500 and NASDAQ 100 are supposed to make fresh all-time highs before the calendar turns. That’s my line in the sand. That is what should happen. If that scenario does not take place I will be rethinking a number of things and tempering my enthusiasm.
Finally, below is something new and experimental I have been tinkering with for a few years. Green arrows mean a zone to buy and red to sell. The number of arrows seems significant to me. Look on the far right of the chart and you tell me what me it means.
(Click on image to enlarge)

Christmas weekend is upon us and it’s always great to be in Vermont for that. It has become a tradition that my family heads over to our friends’ house for Christmas night feast along with a few other families. It is one of the highlights of the year. I always chuckle that my family and the others invited are Jewish. I consider my friend who hosts as an adopted Jew even though he is Christian. In the end it’s all about friendship and family and no one cares what race, creed, color or religion anyone is.
For those celebrating I wish you a very Merry Christmas and I hope you are surrounded by family and friends.
On Wednesday we bought SSO. We sold LIN, ALCO and some WEBL. On Thursday we bought DRN and more levered NDX. We sold SSO.
More By This Author:
Runaway Momentum Crushing Everything In Its WayFed Rate Cut Next Move – Bears Remain Embarrassingly Wrong
“Paul The Bear” – Doesn’t Really Ring
Please see HC's full disclosure here.


