
Today we discuss one of the technology sector’s darlings. It’s a market leader and a high-flier… it’s Nvidia (NVDA).
The stock price recently surged after the company hit a homerun with their recent earnings announcement.
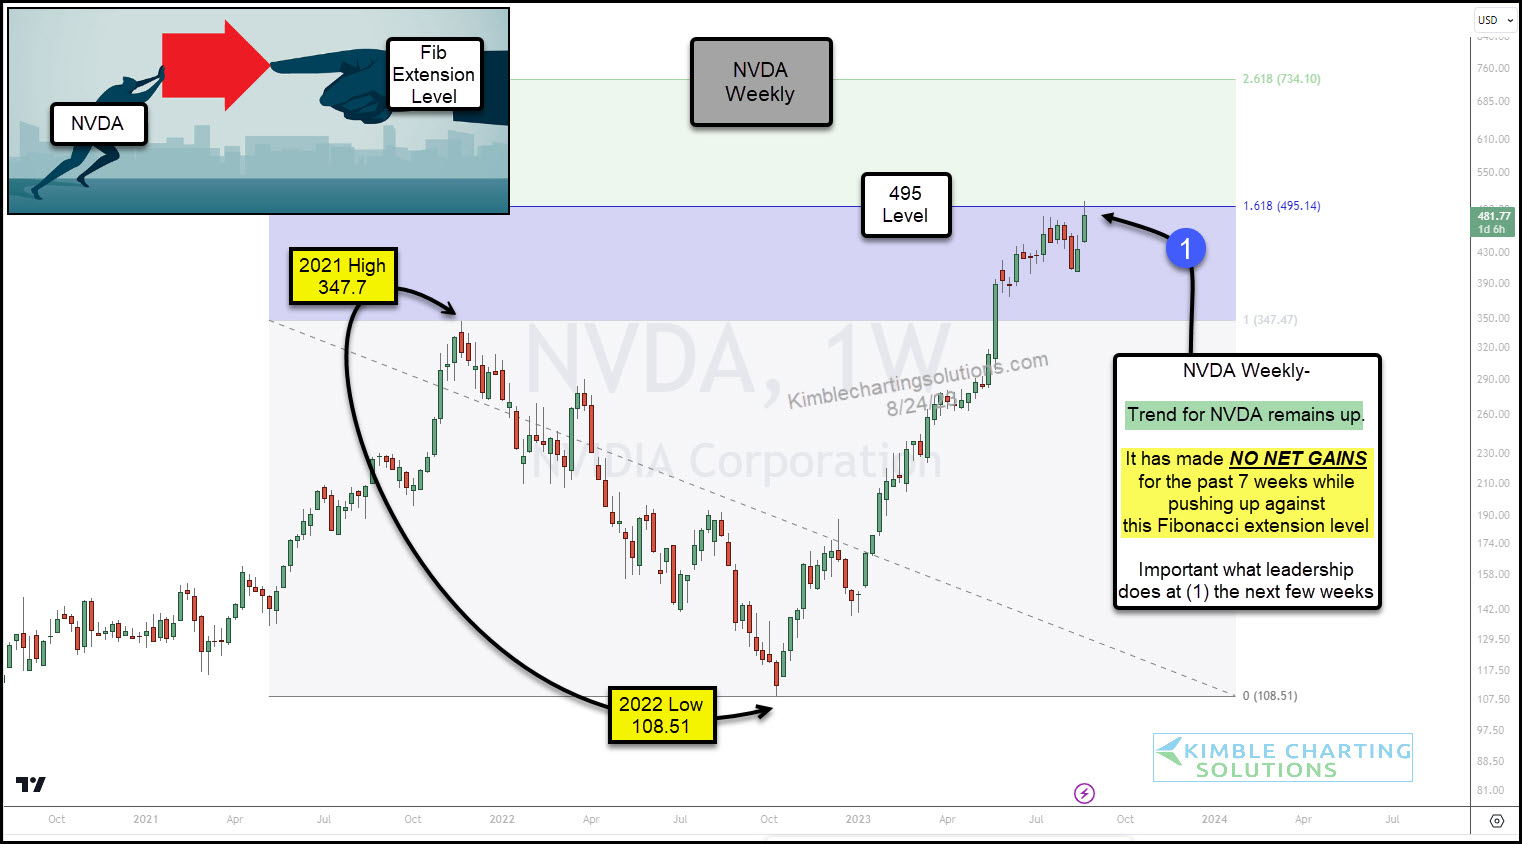
But something important seems to be jumping out at me on Nvidia’s “weekly” stock chart.
We can see that high-flying Nvidia (NVDA) is now flat for the past 7-weeks, which is hard to believe considering the earnings jump!
So what gives? Well, this sideways action is taking place at the 161% Fibonacci price level at (1). This area (+/-) will continue to serve as resistance… until it isn’t.
In my humble opinion, it is important to watch what this market leader does at (1) over the next few weeks. Breakout or stall out?
(Click on image to enlarge)
More By This Author:
Silver Breakout Coming? Fibonacci Price Targets To Consider
Semiconductors ETF (SMH) Nearing Critical Inflection Point
Have U.S. Bond Yields Began A New Long-Term Trend Higher?


Comments
Log in or sign up to join the conversation.