Not All New Lows For Homebuilders
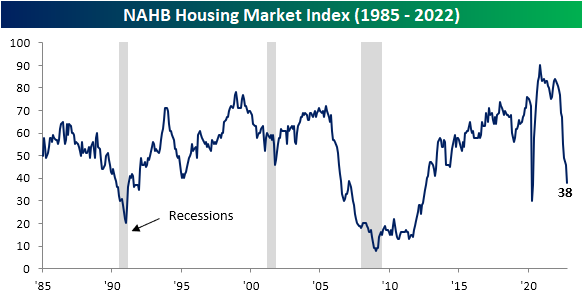
With mortgage rates running higher unabated and mortgage demand decimated, homebuilder sentiment has continued to tank. The latest reading on homebuilder sentiment from the NAHB hit a new post-pandemic low in October dropping from 46 down to 38. Outside of the weaker readings in May and April of 2020, August 2012 was the last time the index was as low as it is now.

Not only is the index at a new cycle low, but the 8-point month-over-month drop also ranks in the bottom 1% of all monthly moves. The declines in the present and future sales indices rank by similar magnitudes.

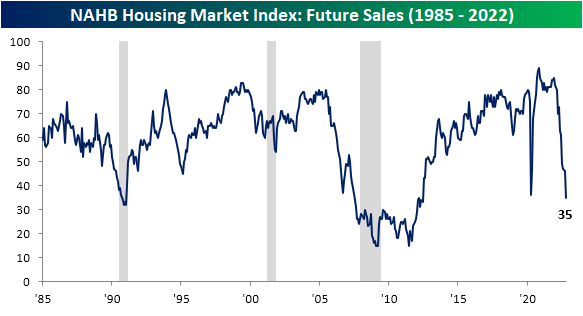
Although the headline index as well as sub-indices like present sales and traffic have not yet taken out 2020 lows, the index for future sales dropped to its lowest level since June 2012. As shown above, it has the lowest reading within its respective range historically of each of the sub-indices.

The only other index in the report that is below 2020 levels is the sentiment in the West region. While the Midwest and South have also fallen precipitously, the Northeast actually experienced a modest rebound in sentiment. Relative to other indices in the report, homebuilder sentiment in the Northeast is remarkably stronger with the index in the 62nd percentile relative to historical readings.
(Click on image to enlarge)

As for the technical picture of homebuilder stocks, recent declines have been a bit healthier than the broader market. Whereas major indices set new 52-week lows as recently as last week, the lows for the S&P 1500 Homebuilders Group at the end of September and the end of last week were between 7% and 8% above the June lows. Albeit the line is somewhat choppy, the relative strength line versus the broader market has also been generally trending upward since the spring as well. In last Monday’s Closer, we further highlighted the disconnect between housing stocks and macro data.

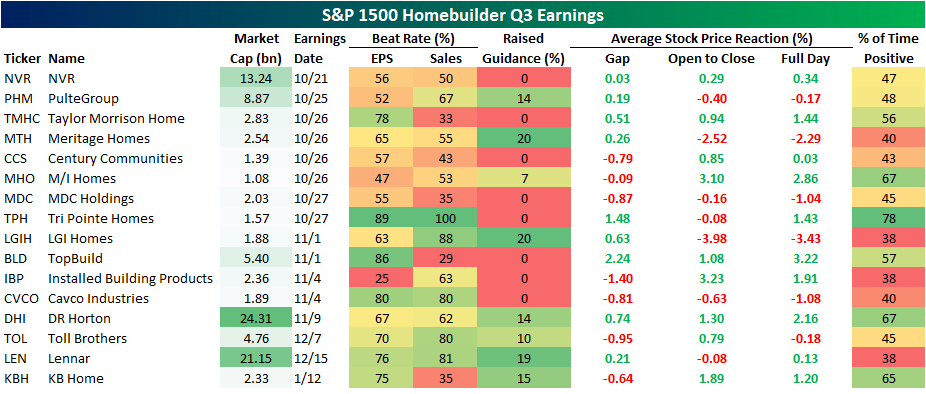
While homebuilder stocks have been holding up surprisingly well, earnings season is on the horizon which has the potential to change that picture; especially if said earnings start to mirror macro housing data. Using data from our Earnings Explorer database, below we show each of the S&P 1500 Homebuilder stocks as well as when they are expected to report earnings and what their historical Q3 earnings beat rates and stock price reactions have been.
Overall, Tri Pointe Homes (TPH) has been one of the strongest performers for Q3 with a positive reaction by the stock 78% of the time as it possesses the strongest beat rates as well. In fact, for TPH Q3 ranks as the best quarter of the year for stock price reactions. That is also the case for TopBuild (BLD) and KB Homes (KBH). Conversely, Q3 marks the weakest response to earnings for LGI Homes (LGIH), Cavco Industries (CVCO), Toll Brothers (TOL), and Lennar (LEN).
(Click on image to enlarge)

More By This Author:
Flip Flopping Like A Politician
Hurricane Claims Come In
Semis Set To Turn?
Click here to learn more about Bespoke’s premium stock market research service.
See Disclaimer ...
more


