
Given their ubiquity in just about every aspect of our lives, the performance of semiconductor stocks provides a great barometer for the health of the economy. Therefore, yesterday’s new high in the VanEck Semiconductor ETF (SMH) was an encouraging sign for the broader economy.

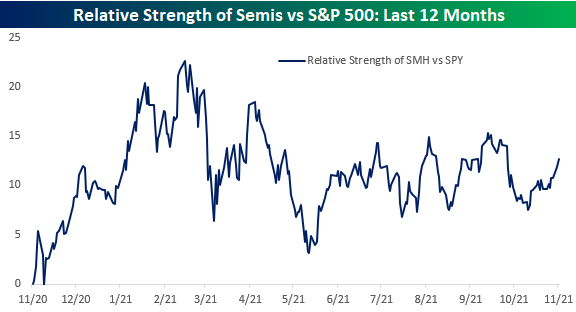
While prices, on an absolute basis, are at new highs, semiconductors haven’t been nearly as strong relative to the performance of the broader market. The chart below shows the relative strength of SMH versus the S&P 500 ETF (SPY) over the last 12 months where a rising line indicates outperformance on the part of the semis and a falling line indicates underperformance. After closing out 2020 on a strong note and continuing that strength right up through the first two months of the year, semiconductors had a rough three months on a relative basis through May and have been moving pretty much in line with the S&P 500 ever since. One notable aspect of the sector’s relative strength has been that despite the new high in the broader market, the relative strength of semis is not only well off its high from earlier in the year, but still hasn’t even surpassed the recent peak levels from early August and early September. A move above those levels would be a positive development for the group.
The table below lists the holdings of SMH and shows each one’s performance YTD and over the last five trading days, as well as where they closed on Tuesday relative to their 50-day moving averages (DMA).On the right side of the table, we also show where each stock is currently trading relative to its trading range. Whether you look at the performance of individual stocks on a YTD basis or where they are trading relative to their trading ranges, there hasn’t been a strong degree of uniformity in the group. On a YTD basis, returns for stocks in the ETF range from a gain of 102% for NVIDIA (NVDA) to a decline of over 20% for Universal Display (OLED). Furthermore, just 12 of the 25 companies listed below have outperformed the S&P 500 YTD. On a more short-term basis, performance has been just as uneven with ten stocks up over 5%, 12 stocks up less than 5%, and three stocks that are down.


Comments
Log in or sign up to join the conversation.