
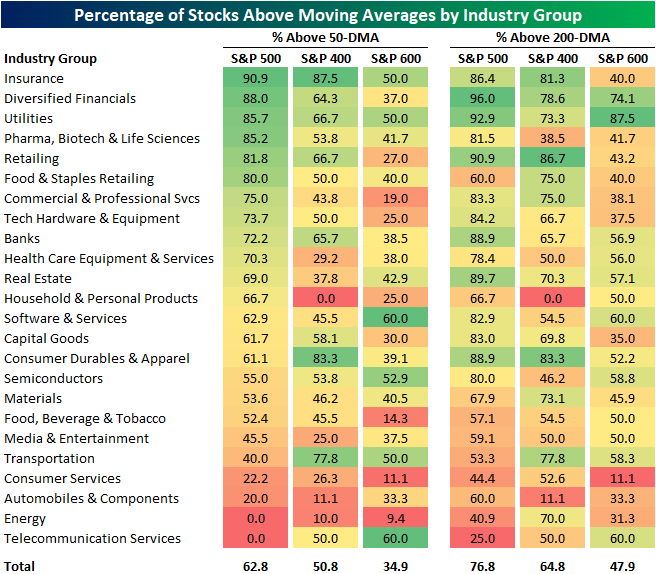
On Friday, we highlighted how a growing number of stocks were falling below their 200 and 50-DMAs recently, but there was a noticeable difference between those readings within large, mid, and small caps. Taking a more granular look, in the table below we show the percentage of stocks currently above their moving averages for each market cap bracket—large- (S&P 500), mid- (S&P 400), and small-caps (S&P 600)—by industry group.
For the most part, each industry group shows the same dynamic in which large caps generally have a stronger reading in the share of stocks trading above their moving averages, but there are a few industries where that is not necessarily the case. For example, mid-caps actually have the strongest readings for industries like Consumer Services and Energy, and Telecommunication Services has the strongest readings for small caps.
As for which industry groups currently have the healthiest readings in the number of stocks above their moving averages, Insurance tops the chart with around 90% of S&P 500 and 400 stocks in the industry above their 50-days. Of course, for small caps, there is a steep drop off though. On the other hand, Diversified Financials and Utilities also have some of the strongest readings in the number of stocks above their moving averages, and that is especially the case with regards to their longer-term 200-DMAs.


Comments
Log in or sign up to join the conversation.