McDonald’s Now Facing Resistance Ahead

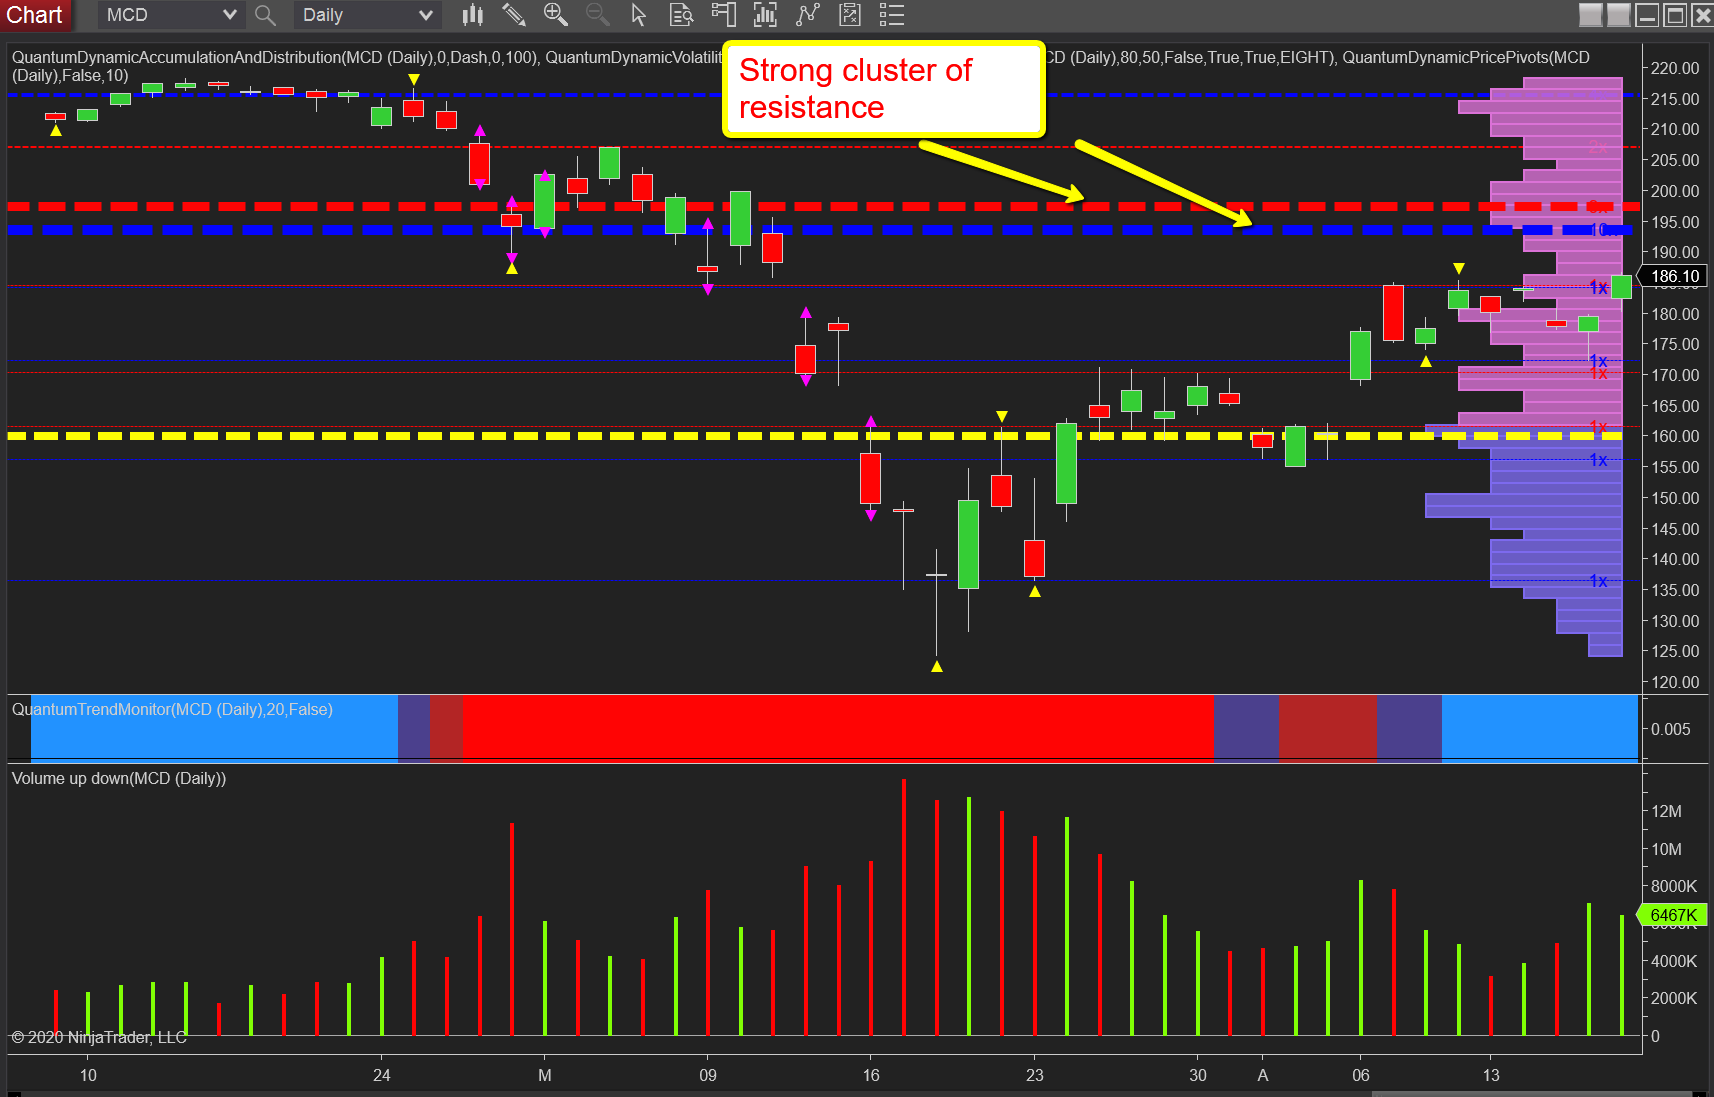
The daily chart for McDonald’s (MCD) makes for interesting reading, and continues to remain bullish, as I mentioned in a previous post and as confirmed with the volume on both Thursday, April 16, and Friday, April 17, last week.
Thursday’s price action saw the stock move lower, only for it to recover during the session and close higher on the day, with excellent buying and a strong signal of intent to move higher. Friday opened up on good volume, with the stock closing the week at $186.10.
However, further advancement for this stock is likely to be harder, given the two strong areas of resistance now immediately ahead at $193 and $197, respectively. Each is strong in its own right, but together, they constitute a serious area of resistance, as denoted with the red and blue dashed lines of the accumulation and distribution indicator.
The thickness of the line describes the strength of each area and is calculated automatically by the indicator, and is likely to present a solid barrier and defense of the $200 per share price. Given the strength of this resistance, it will take excellent volume to drive through this region. Meanwhile, the trend monitor continues to confirm the bullish picture, and should the $200 be attained, the stock will have a solid support platform for the next move higher.
Disclaimer: Futures, stocks, and spot currency trading have large potential rewards, but also large potential risk. You must be aware of the risks and be willing to accept them in order to invest in ...
more


