
Markets Are Choppy, But This One Zone Could Tell Us What’s Next For The S&P 500

Image Source: Pixabay
Find out the key support zone, demand and supply signals, and what traders should watch next in this volatile, choppy market.
Watch the video from the WLGC session on 21 Oct 2025 to find out the following:
- How can traders identify when demand is returning after a selloff?
- How should traders approach breakout setups in a choppy market?
- Why volume behavior is key to confirming supply and demand zones.
- Identification of a significant supply zone and assessment of current price behavior using the H1 timeframe
- And a lot more…
Video Length: 00:03:36
Market Environment
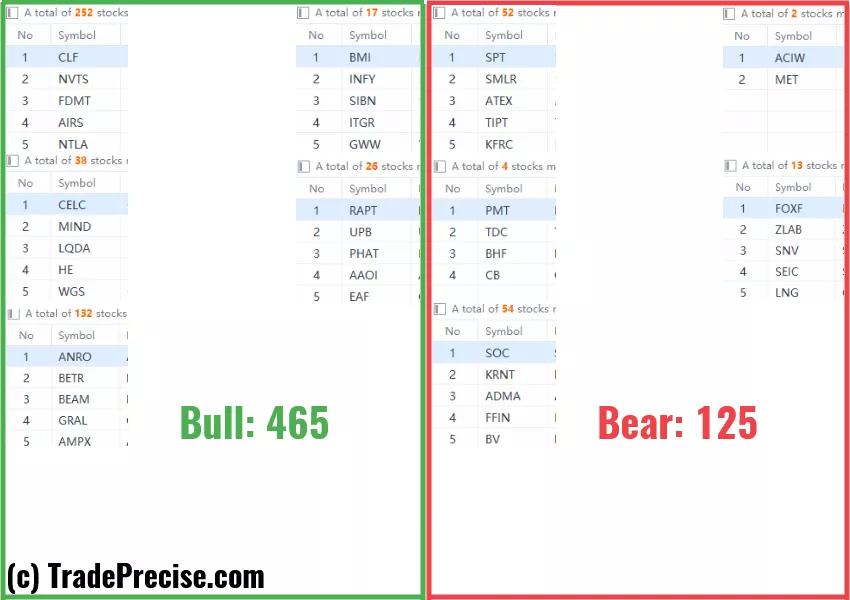
The bullish vs. bearish setup is 465 to 125 from the screenshot of my stock screener below.
(Click on image to enlarge)
3 Stocks Ready To Soar
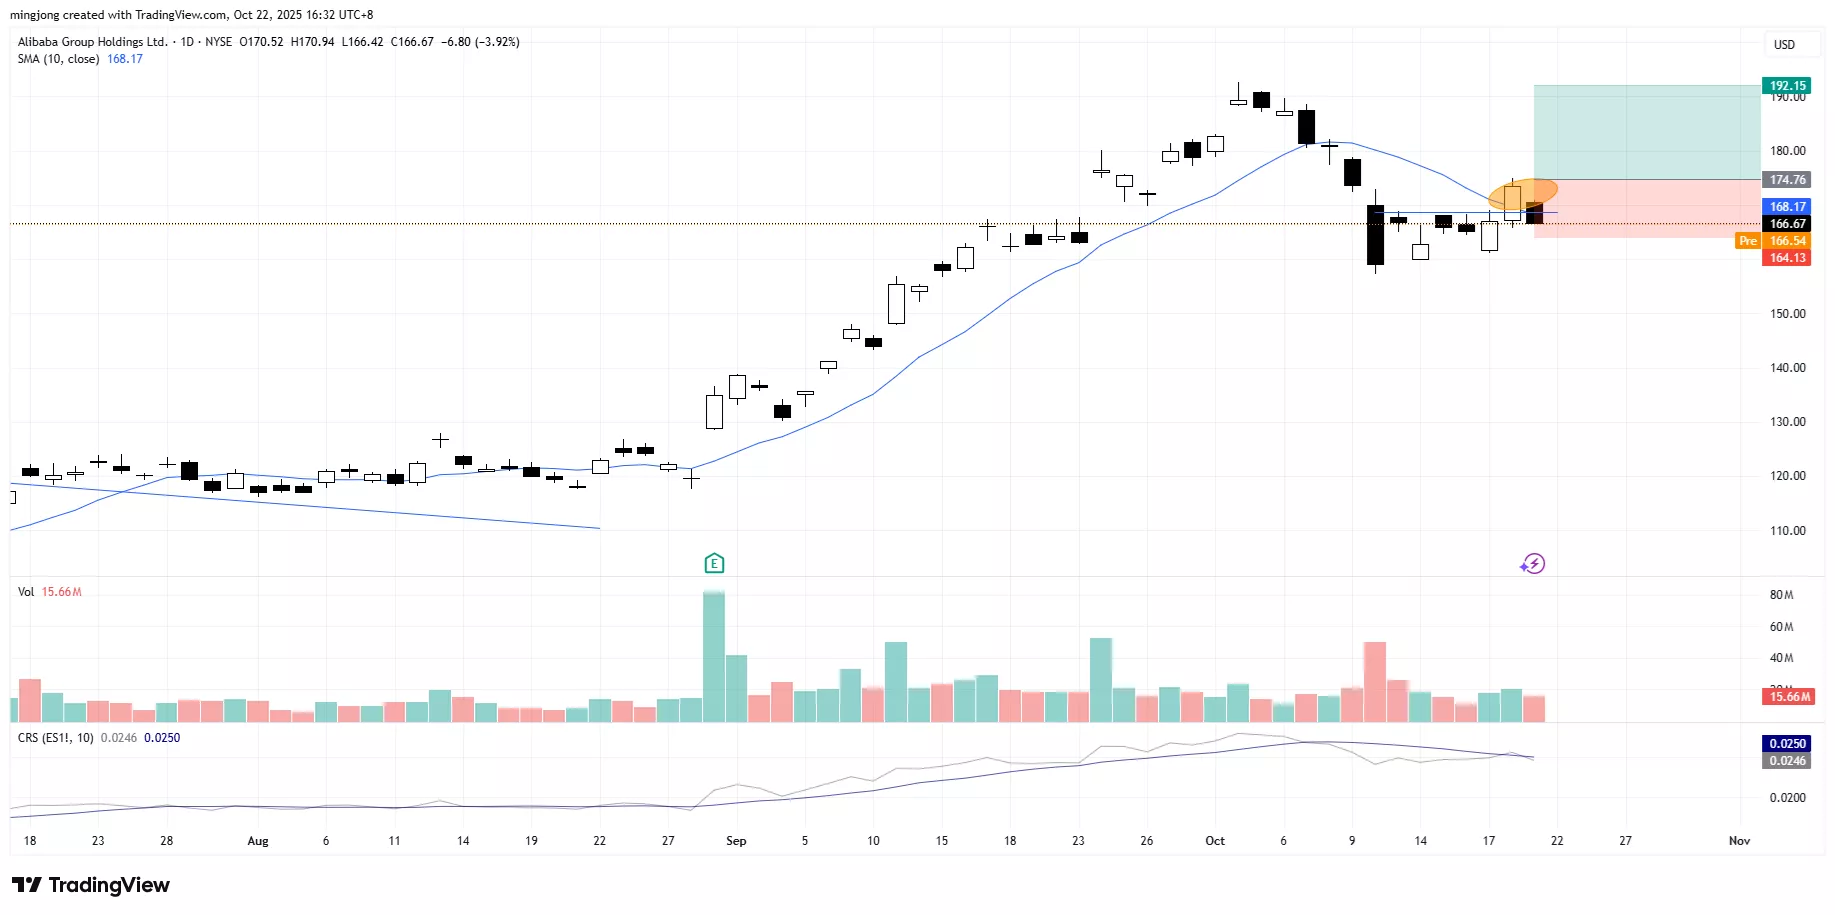
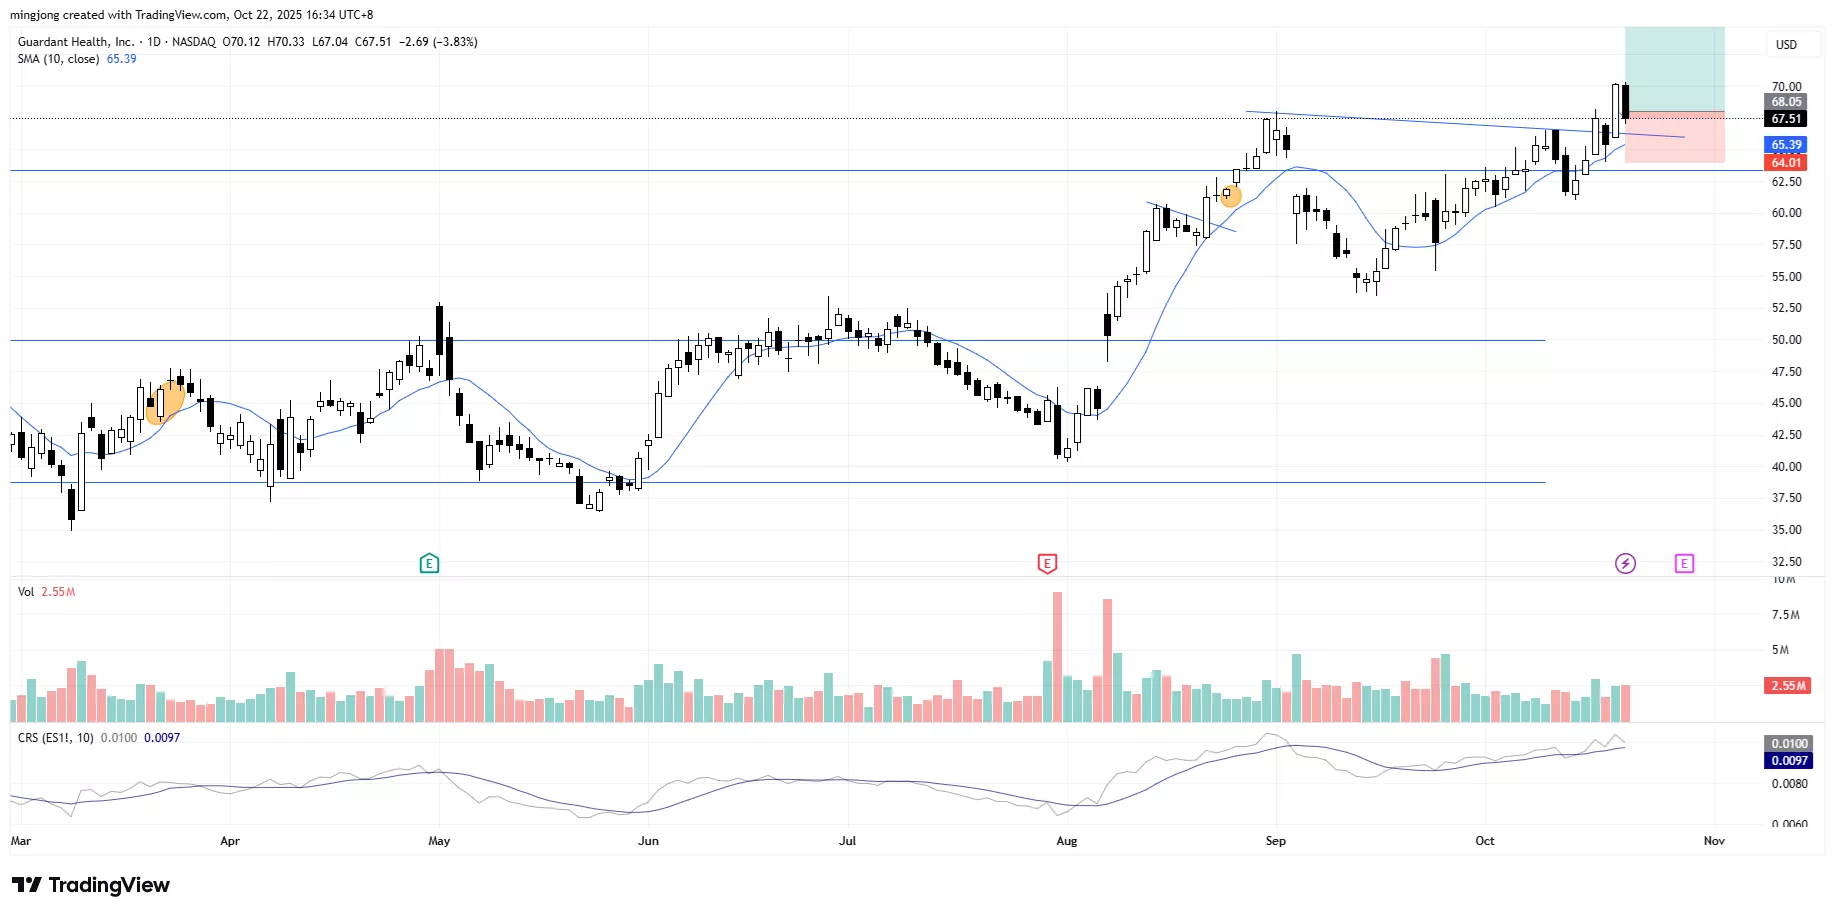
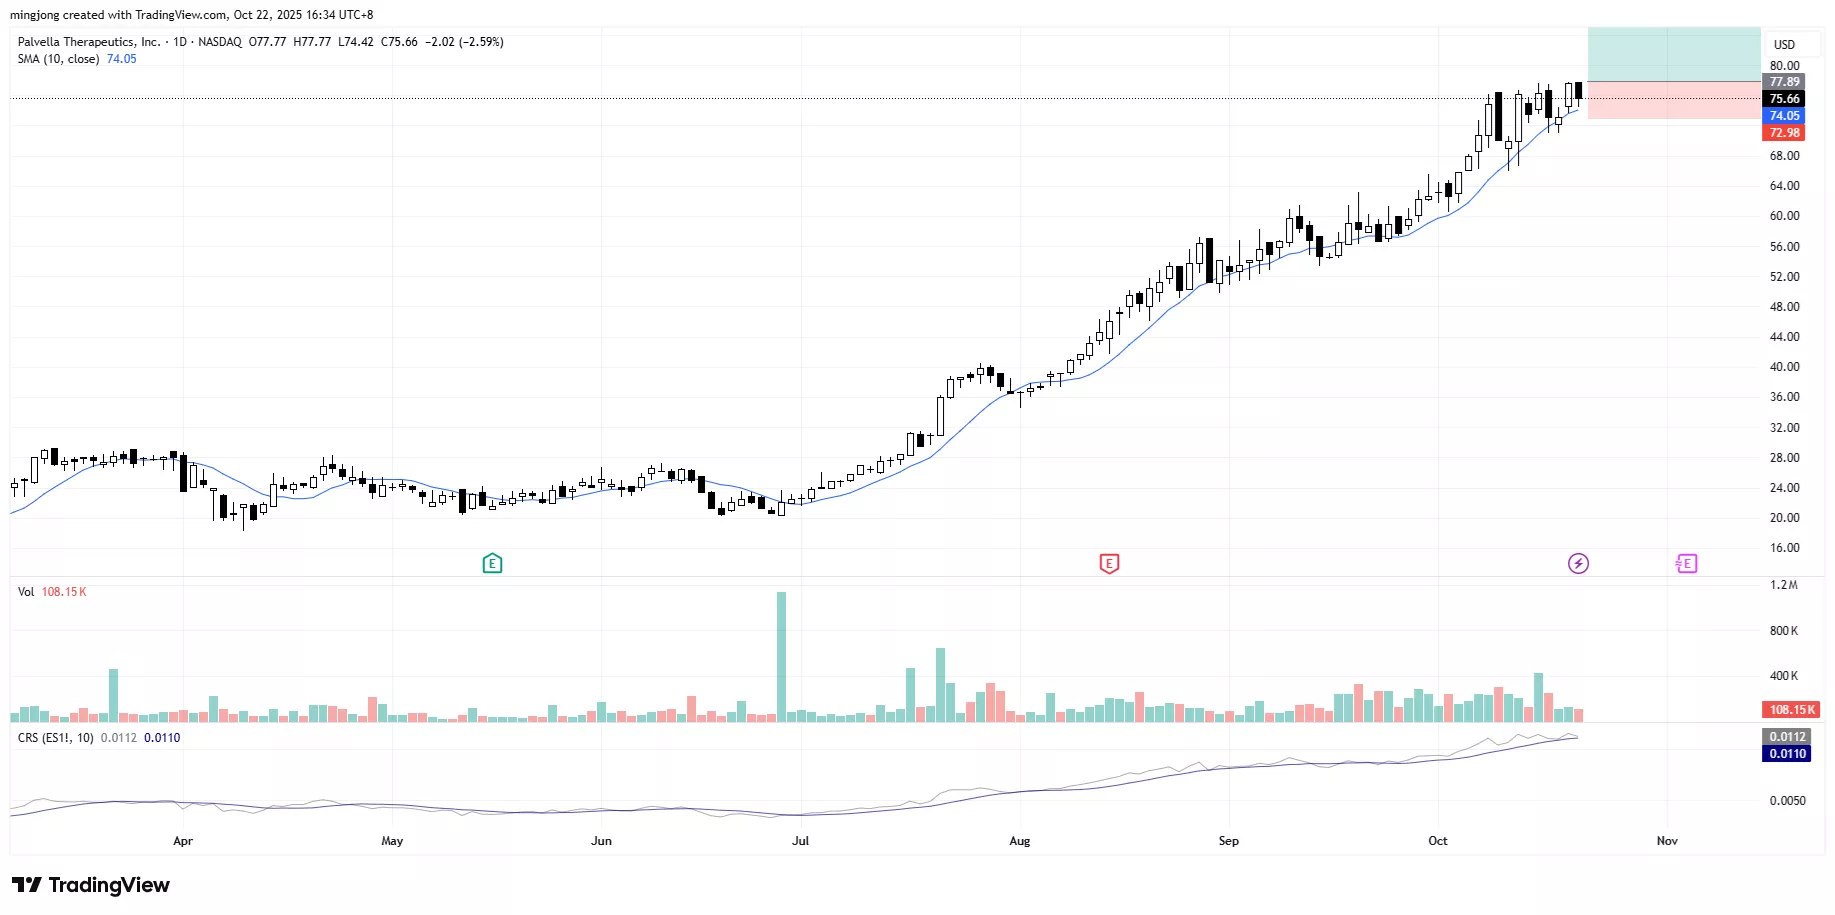
21 actionable setups such as BABA, GH, PVLA were discussed during the live session on 21 Oct 2025 before the market open (BMO).
(Click on image to enlarge)
(Click on image to enlarge)
(Click on image to enlarge)
More By This Author:
Market Shock: Change Of Character Bar Just Wiped Out A Month Of Gains — Start Of A New Phase?
3 Reactions, 1 Message - This Market Setup Looks Eerily Similar To The Last 2 Analogues
Gap Support Tested Twice: Is The Market Quietly Building For A Year-End Rally?
Disclaimer: The information in this presentation is solely for educational purpose and should not be taken as investment advice.


