

Image Source: Unsplash
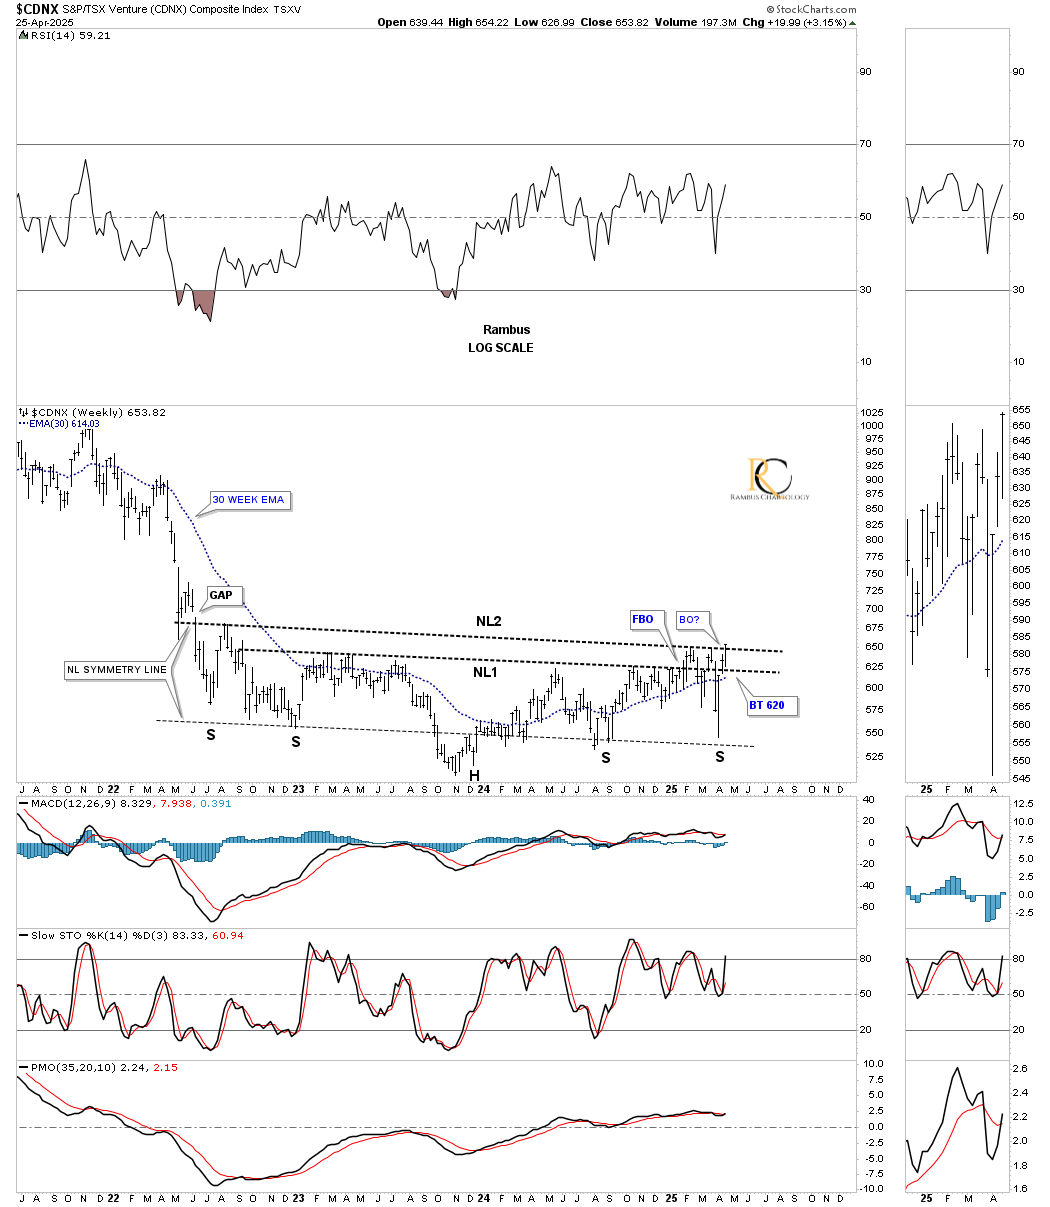
With the PM complex taking a breather this week, there is one bright spot, the CDNX, which is where many of the micro-cap PM stocks reside. This week, the price action broke out above NL2 after the second NL forced one more right shoulder, completing the symmetry for the nearly three-year inverse H&S bottom. It appears the small and micro-caps are about to join the party.
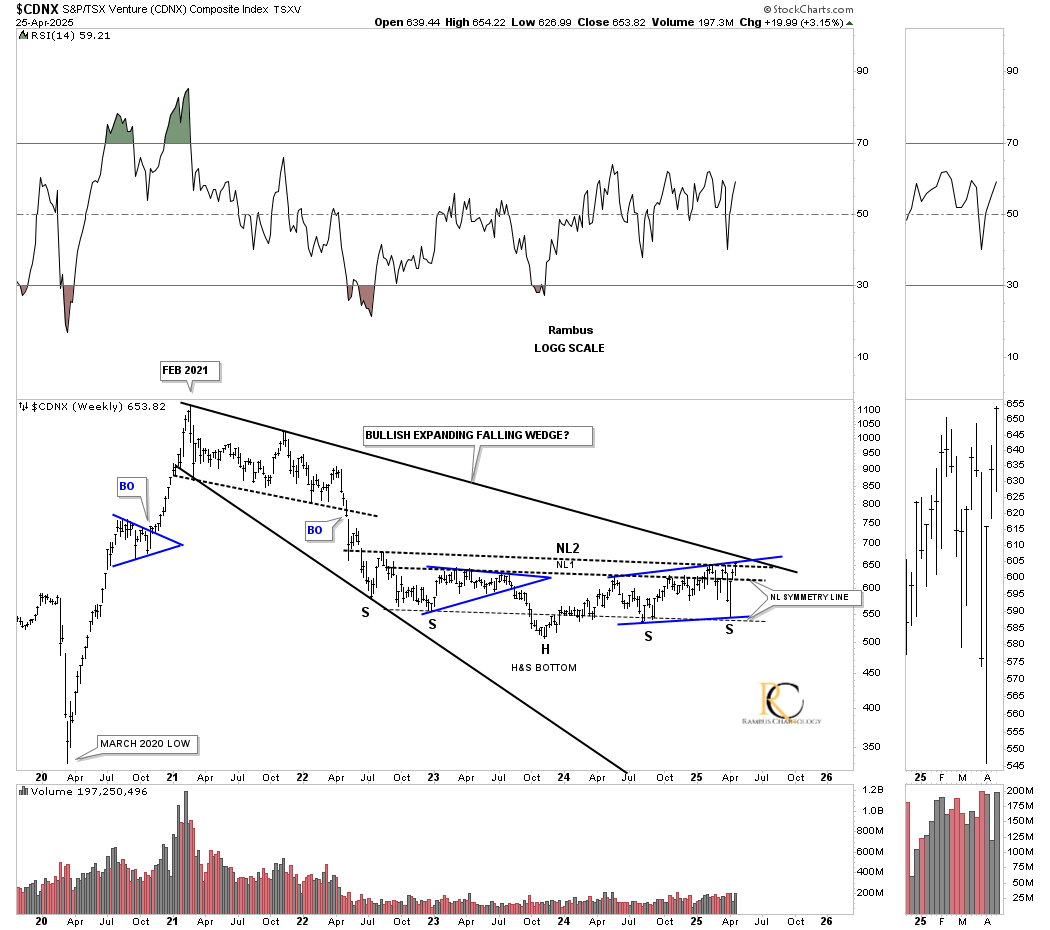
This longer-term weekly chart shows how the three-year inverse H&S bottom has finally reached the top rail of the 2021 bullish expanding falling wedge, which is one of the most bullish chart patterns there is. For me personally, it’s always interesting to watch how the price action interacts with the overhead resistance lines. Will there be a lot of backing and filling between the resistance lines, or will we see a hard and fast breakout above the top rail of the bullish expanding falling wedge?
This monthly chart shows how the inverse H&S bottom fits into the historical chart. As the breakout gains momentum, we should see volume start to pick up once again when interest finally kicks in.
More By This Author:
Decoding The Precious Metals Charts: A Bullish OutlookPrecious Metals Complex Impulsing Higher
Weekend Report: Gold’s Confirmed Breakout


Comments
Log in or sign up to join the conversation.