
Market Melts Up As Fed Turns On The Liquidity Firehose

“We are so overbought, and this is feeling like a panicky-just-get-me-in buy day. Be careful about being impressed.” – Kevin Muir
Let me start this week, taking the lead from my dear friend Victor Adair of Polar Futures Group:
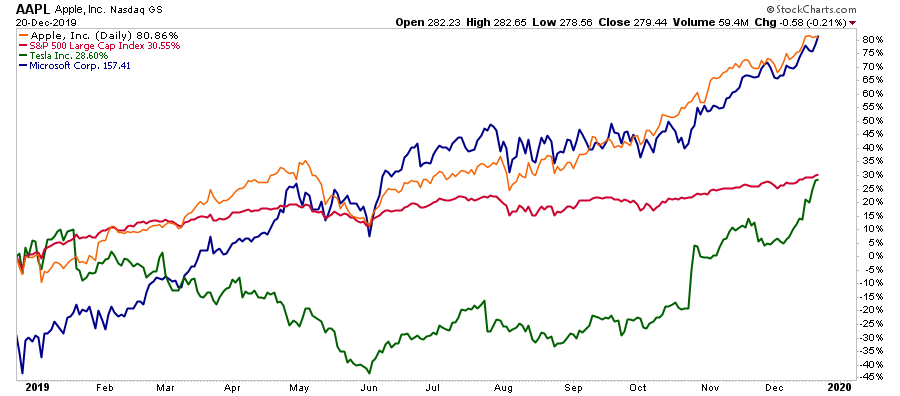
“The S&P 500 keep printing new ‘all-time highs’ while complacency reigns even as the CNN Fear & Greed index is flashing extreme greed. Volatility is ultra-low across all markets, the put/call ratio is at a 5 year low and credit spreads are tight. People are reaching for yield, and have no interest in buying downside protection. AAPL is up 100% in 12 months, but TSLA has more than doubled in just 6-months…a poster child for the market’s current exuberance!”
As we discussed previously, the market has been primarily lifted by the largest companies in the S&P 500. In our interview with Thomas Thorton of Hedge Fund Telemetry it was noted that Apple and Microsoft have made up 38% of the YTD rally in the market. Another 38% was supported by the next 15 largest stocks with the remainder brought up by the other 483 stocks in the index.
As I noted in our MacroView Outlook for 2020, and as Victor notes above, the levels of outright complacency and bullishness have reached extremes. The following is our composite “Fear/Greed” gauge with is based on actual market positioning between individuals and professional investors. Since this is a four-week moving average, it moves more slowly, but with short-term readings spiking higher, I would expect this gauge to be well entrenched at the “Greed” level by year-end.
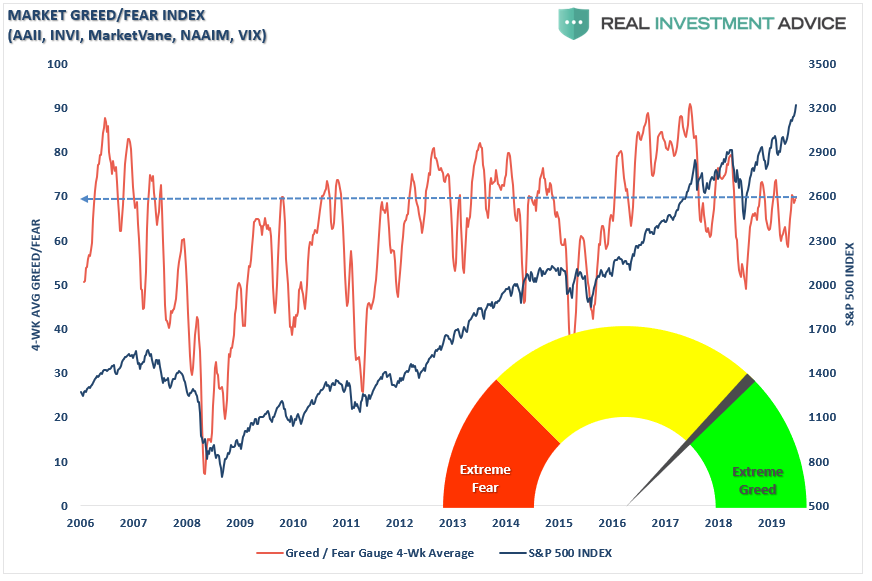
As Victor notes, this is quite a swing from where we were just one year ago as the markets were in the midst of a near 20% decline.
“A year ago today the CNN index was flashing extreme fear…the S+P index was at 18-month lows…having fallen nearly 20% in less than 3 months…but just a couple of days later it began to rally and is now up ~37% from those lows.”
Why the change?
Two words: Monetary Stimulus
While the media continually droned on about the Trade War the primary reason for the reversal in the markets was the massive reversal in monetary policy.
As Stanley Druckenmiller said this week:
“You have very low unemployment. You have fiscal stimulus in Japan. You have fiscal stimulus and a lot of confidence coming to Britain. We are running a trillion-dollar deficit at full employment. Apparently, we are going to have some sort of green stimulus in Europe. And we have negative real rates everywhere, and negative absolute rates in a lot of places. So with that kind of unprecedented monetary stimulus relative to the circumstances, it’s hard to have anything other than a constructive view on the markets, risk, and the economy in the intermediate-term.”
He is right,
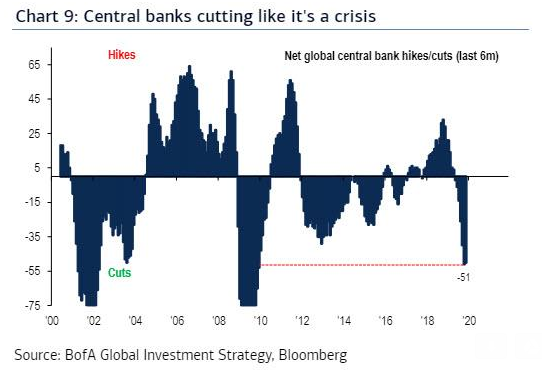
However, this stimulus is the largest ever outside of a recession or financial crisis, which should lead to the obvious question of “what exactly is going on we don’t know about?”
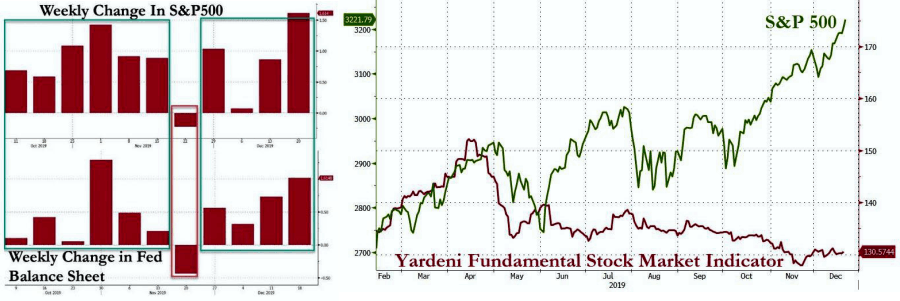
Over the last three months the Fed has been fighting a “repo inferno” flooding the overnight lending market with billions in short-term funding. While the Federal Reserve accurately states this is NOT “Quantitative Easing,” market participants didn’t get the memo. The market has risen in every single week the Fed has been active, despite collapsing fundamentals. (h/t ZeroHedge)
Portfolio Positioning
As we have noted over the past year, we have remained primarily allocated toward equity exposure, but have also worked around the edges hedging risk, raising stop levels, and remaining primarily domestic-focused. Given our outlook for a steeper yield curve earlier this year, we also shorted duration in our bond allocations, increased credit quality, and carried a slightly higher than normal level of cash.
Currently, that remains the case with the exception that we have now started to make a small shift into value as the momentum trade is now exceptionally extended. The chart below shows the relative performance of momentum versus value which is currently at a level last seen in 2000.
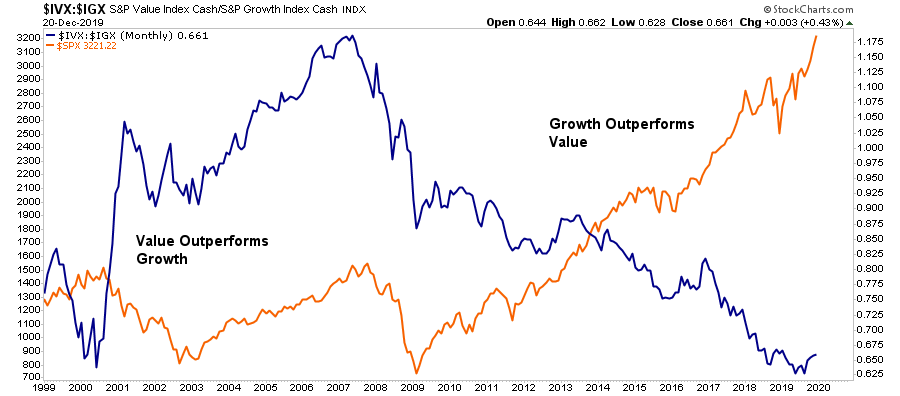
With the markets extremely deviated from long-term trends, extremely complacent, and overly bullish (as noted above), the shift towards value adds a defensive component to our portfolio risk management strategy (more on this in our MacroView).
While none of this means the next “bear market” is lurking, it does suggest that a fairly decent 5-10% correction is likely over the next couple of months.
As we head into the final few trading days of the year, it is worth reminding you of “the rules” we penned in last week’s missive. These processes follow our basic rules of portfolio management, which you can apply to your portfolio as well to reduce overall volatility risk.
- Tighten up stop-loss levels to current support levels for each position.
- Hedge portfolios against major market declines.
- Take profits in positions that have been big winners
- Sell laggards and losers
- Raise cash and rebalance portfolios to target weightings.
Notice, nothing in there says, “sell everything and go to cash.”
Remember, our job as investors is pretty simple – protect our investment capital from short-term destruction, so we can play the long-term investment game.
Of course, if the Fed fails to “extinguish” whatever “blaze” they are currently battling, then we will begin to have a very different conversation about risk, positioning, and liquidity.
Opportunities In A Melt Up
In June, we shared with our RIA Pro subscribers our strategy for playing the “UN-Inversion” of the yield curve using an under-followed sector of the market, agency REITs. This sector not only pays shareholders double-digit dividends, but was also trading at a very cheap valuation. Such is quite the rarity in today’s markets. Since then, the shares are up nearly 5%, and we have clipped generous coupons.

Since then, we have been looking for the next opportunity to create returns without taking on excess risk, and for that we have been digging around one of the most beaten-up sectors of the market.
Last week, we presented RIA Pro readers another high dividend stock, and sector play, trading at a dirt-cheap level. This recent selection offers a similar value proposition and a 9.60% dividend. Like the recommendation in June, we also purchased the security for our clients.
Market & Sector Analysis
Data Analysis Of The Market & Sectors For Trader
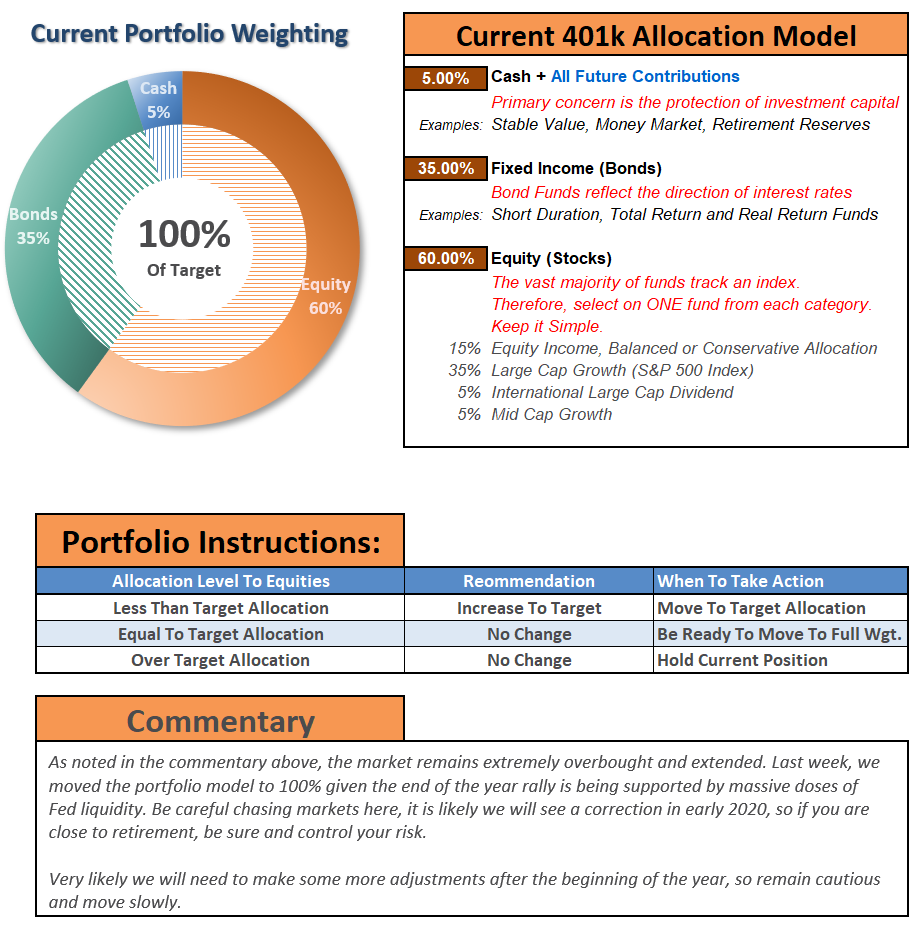
THE REAL 401k PLAN MANAGER
A Conservative Strategy For Long-Term Investors
The 401k plan allocation plan below follows the K.I.S.S. principle. By keeping the allocation extremely simplified it allows for better control of the allocation and a closer tracking to the benchmark objective over time. (If you want to make it more complicated you can, however, statistics show that simply adding more funds does not increase performance to any great degree.)
Click Here For The “LIVE” Version Of The 401k Plan Manager
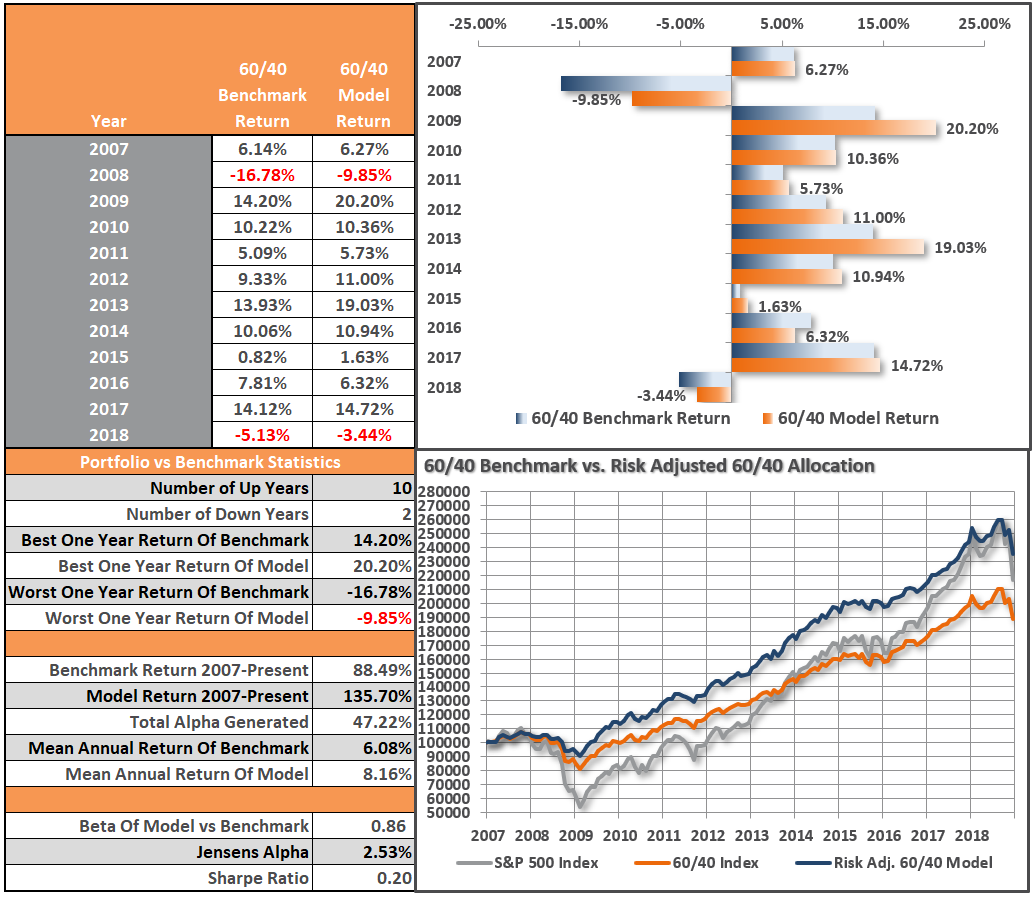
See below for an example of a comparative model.
Model performance is based on a two-asset model of stocks and bonds relative to the weighting changes made each week in the newsletter. This is strictly for informational and educational purposes only and should not be relied upon for any reason. Past performance is not a guarantee of future results. Use at your own risk and peril.

Disclosure:
Join us at RIA Pro to learn more about this position, as well as gain our unique daily market intelligence, access to our ...
more

