
In a bold and unusual pivot, a traditional Japanese manufacturer of Kimonos is transitioning to a cryptocurrency treasury company. Marusho Hotta, which has been manufacturing kimonos since 1861, will rebrand as the Bitcoin Japan Corporation. The transformation stems from a June acquisition by Bakkt Holdings (BKKT), which took a controlling stake in the company to reposition the struggling kimono manufacturer into a Bitcoin treasury entity focused on stockpiling crypto assets and launching related financial operations. The graph below shows that BKKT, the predominant shareholder of the kimono-turned-crypto treasury company, has jumped from $10 to $30 since the announcement.
The story reminds us of the Long Island Ice Tea Corporation. This relatively small beverage producer, specializing in non-alcoholic iced tea and juice drinks, underwent a dramatic pivot in January 2015 amid the emerging cryptocurrency boom. The company rebranded to Long Blockchain Corporation (LBCC). The name change and announced shift toward blockchain and Bitcoin mining technology caused its shares to surge by over 400% in one day. The gains were short-lived. The stock ultimately rose from $0.50 a share to over $10. However, by the beginning of 2018, the stock price was down to $0.10 per share. Today its price is $1.10. Will the 150-year-old maker of kimonos follow a similar path?
Please note that BKKT is a holding in our thematic Crypto model. Yesterday we took advantage of a nearly 50% gain in the stock and took profits to rebalance back to its model weight.

What To Watch Today
Earnings
(Click on image to enlarge)

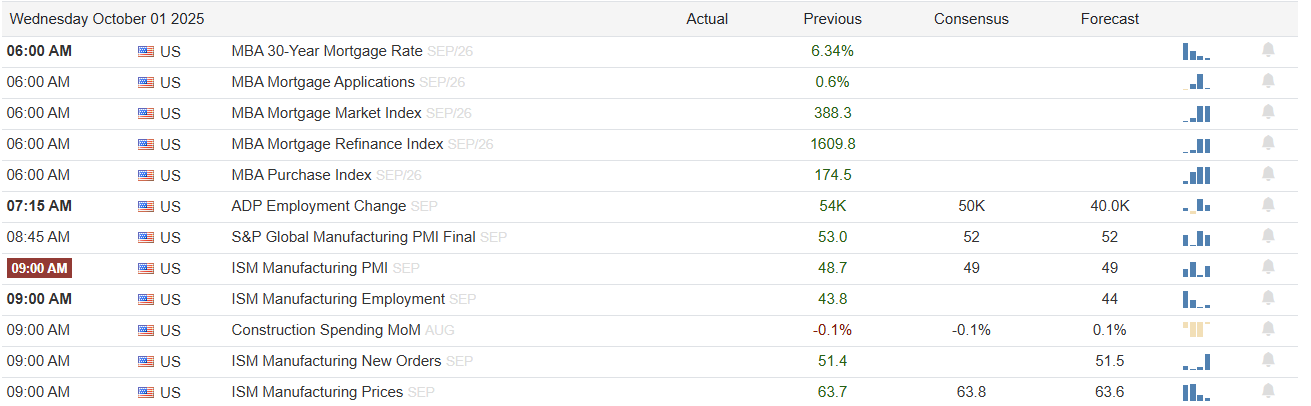
Economy
(Click on image to enlarge)
Market Trading Update
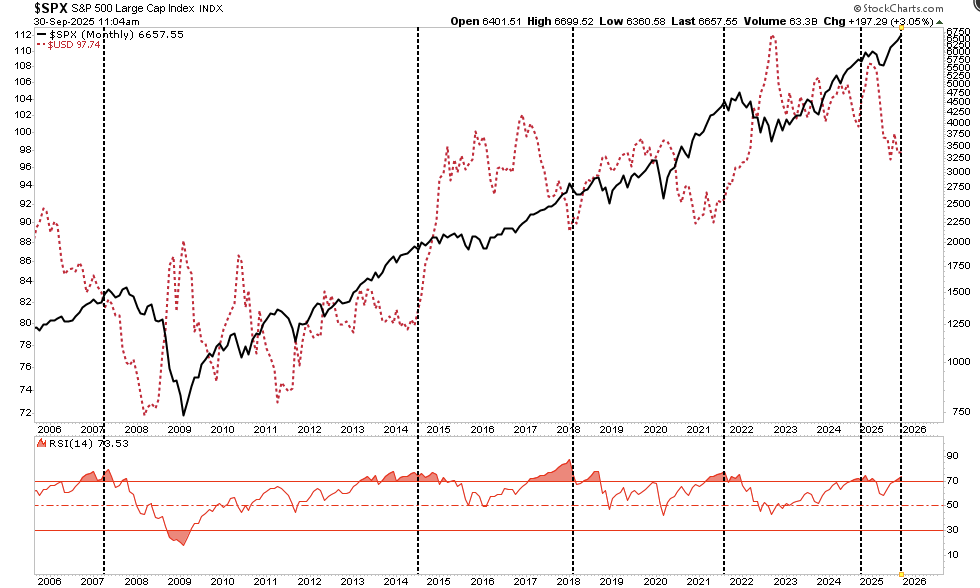
Yesterday, we discussed the potential setup for a strong US Dollar trade. A dollar rally could negatively impact numerous markets, particularly stocks and commodities. The impact on commodities is evident as a stronger dollar reduces demand from international trading partners. However, the stock market is slightly different, and the correlation is not as clean.
However, when the dollar strengthens, companies that trade internationally experience an impact on demand, as foreign consumers are affected by higher costs. Due to the strong dollar, corporate profit margins and earnings come under pressure. At the same time, investors have been pushing stock prices higher on the back of improved earnings and margins, partially due to the dollar’s weakness over the last three years.
More critically, when the dollar begins to rally concurrently with a very overbought market (RSI >70 monthly), the outcome for investors has not been as good.
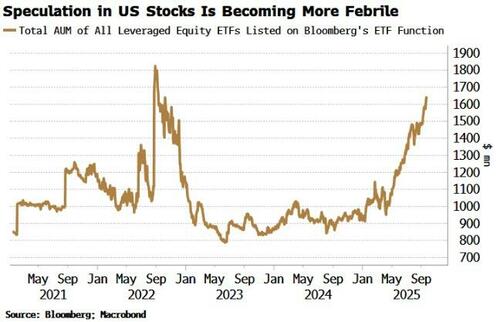
With speculation intensifying, stocks hovering near highs, and volatility falling, it’s not a surprise that greed is starting to set in. As noted by Bloomberg:
“One place to overtly see that is in the rising interest in leveraged ETFs. When gaining only the simple upside in the equity market isn’t enough, these offer two, three, or even four times the return of indexes, sectors, or certain stocks. Inflows on a one-year rolling basis to all of the leveraged equity ETFs I could find on Bloomberg’s ETF page are as high as they’ve been for over a year. Along with rising valuations, that’s taken the total AUM of leveraged ETFs close to the highs reached in August 2022, just before the market topped.
As an indication of how manic things are getting in some parts of the market, the leveraged ETFs seeing the largest inflows on a one-year basis are those offering exposure to gold and gold miners. Gold’s moves are pretty spectacular on their own without juicing them up three or four times more!“
Given the highly negative correlation between the dollar and commodities, the risk to investors is starting to mount. As Bloomberg concludes:
“Increasingly wilder speculation doesn’t tell you exactly when the market top will be, but it does tell you we’re entering the endgame.“
Pay close attention to the dollar.
Finding Pair Trades With SimpleVisor
A pair trade is a market-neutral strategy that simultaneously takes a long position in one security and a short position in another security. Often, the securities tend to be correlated over longer periods of time. Accordingly, the two securities are frequently in similar industries or asset classes. The goal is to profit from a convergence of their return correlation, following a recent divergence. Once two securities with a significantly divergent relationship are identified, the trader goes long on the underperforming asset and short on the overperforming asset.
We can use SimpleVisor to help us find potential pair trades. For example, we begin with the first graphic, which shows a significant deviation in the relative and absolute scores of two materials companies, APD and VMC. To determine if their returns are irregular compared to each other, we examine the correlation of their relative returns (compared to the S&P 500) over the last 252 trading days. The second graphic shows the relationship is in the .40 percentile. In other words, the correlation is very close to its lowest point in the last year. The relationship is stretched.
Lastly, we utilize technical analysis to better assess the pair trade. The top graph (blue line) of the third graphic shows the ratio of the APD price to the VMC price. As shown, the ratio peaked in March at 1.40. Since then, APD has grossly underperformed VMC. The ratio is now at .88. Below the ratio graph lie three momentum gauges. All three point to the relationship being deeply oversold, but none have triggered a buy signal. Moreover, the gauges are not forming a divergence (higher lows). Accordingly, we would recommend keeping a close eye on the two stocks and being patient before going long on APD and short on VMC.
(Click on image to enlarge)

(Click on image to enlarge)

(Click on image to enlarge)

Tweet of the Day
More By This Author:
The Government Is Shutting Down Again: Who Cares?RSI (Relative Strength Index): Timing The Next Correction
Markets Detached From Economic Fundamentals


Comments
Log in or sign up to join the conversation.