It’s Getting Wilder, Time To Revisit J.W. Wilder
The global technical analysis is mourning the loss of one of its true giants, J. Welles Wilder Jr., who died in April aged 85. Formerly a mechanical engineer and real estate developer, Wilder turned his skills to technical market analysis, publishing "New Concepts in Technical Trading Systems" in 1978. He created several technical indicators that have stood the test of time and are now considered to be core in any technical analysis software. These include the Average True Range, Average Directional Index, and the Parabolic SAR (Stop and Reverse). However, it is the venerable Relative Strength Index (RSI) that Wilder will perhaps best be known for.
The RSI is a momentum indicator that measures the magnitude of recent price changes (the ratio of higher closes to lower closes) to evaluate overbought or oversold conditions in the price of a stock or other asset. The RSI is displayed as an oscillator between values of 0 to 100.
Newbies to technical analysis fall in love with the RSI because it appears to tell them when something is "overbought" or "oversold". The realization soon dawns, though, that these terms are meaningless when said newbies witness a market remaining "overbought" or "oversold" for long periods when there is a strong trend. It is then that the secret value in the RSI is revealed. Observing when the RSI and the underlying price diverge can signal trend exhaustion and a potential turning point.
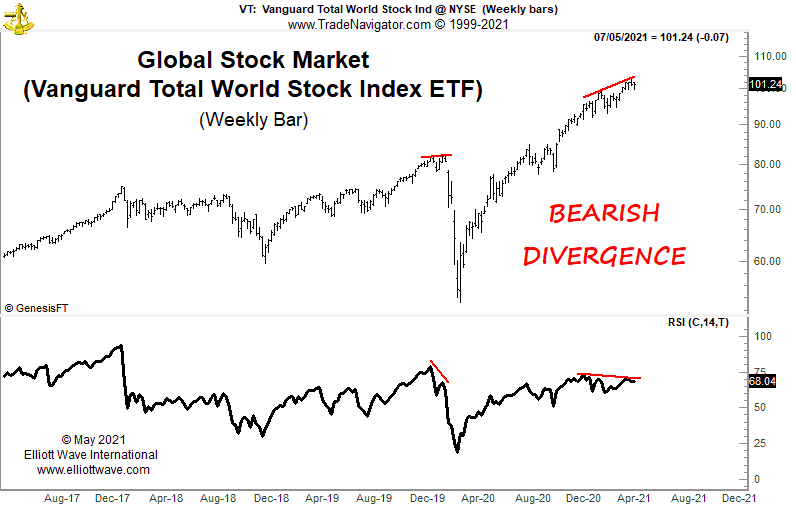
Perhaps it is appropriate, therefore, that right now there could be such a signal in the global stock market after it has experienced such a wildly bullish trend. The chart below shows that the global stock market has been making new highs this year, but the RSI remains below its January high, using a weekly time frame. This is a sign that underlying strength in the trend has been waning. There was also bearish divergence like this, albeit briefly, just before the crash in 2020.
(Click on image to enlarge)

Experienced technical analysts know that you must place every indicator in context, especially with where we are in the Elliott wave pattern. But, with our Elliott wave analysis pointing to a very mature high degree fifth wave in the global stock market, the existence of bearish divergence on a weekly RSI is supporting evidence that things could be about to get much, much Wilder.
Rest in peace, Sir.


