

Image Source: Unsplash
Tesla stock has recently found decent support around the 220 and 230 region. This is in line with the 100 and 200 exponential moving averages on the daily chart. However, there is a week seasonal period ahead for Tesla that could potentially limit further gains. The most significant area on the chart is the overhead resistance in the 270 to 80 region. Should price continue to move higher will sellers step in?
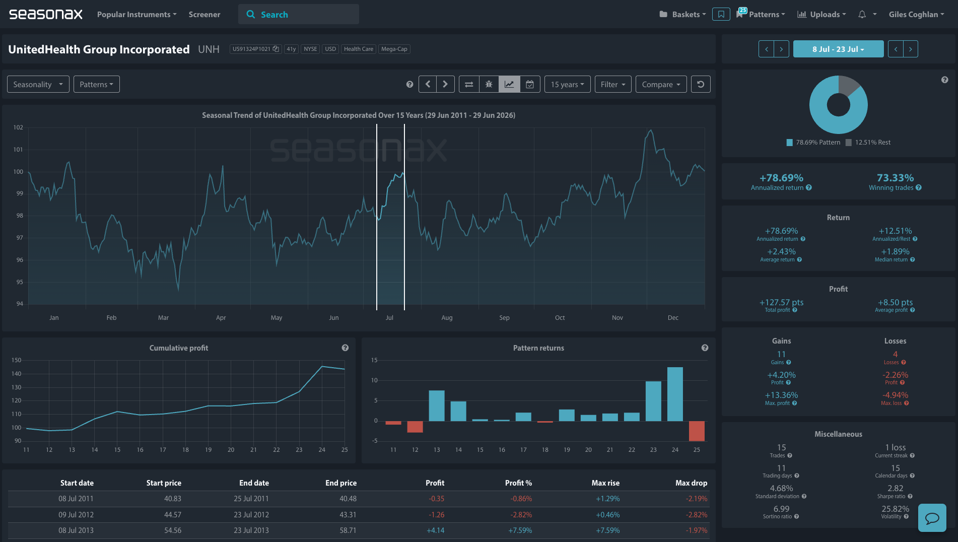
Tesla’s seasonals are certainly worth looking out over the last 13 years between the 1st of September and the 21st of October. Tesla shares have fallen nearly 70% of the time. The average drop has been around 3% and the largest fall was over 22% last year. So, will we see further falls from Tesla this year? Is the 270 to 280 region an area with sellers may step in?
Major Trade Risks: The major trade risks here are that seasonal patterns do not necessarily repeat themselves each year and Tesla’s share price may keep gaining on a stronger-than-expected US economy and/or a recovery from China.
Video Length: 00:01:25
More By This Author:
Will Saudi’s Production Cuts Buck Oil’s Weak Seasonals?
RBA: Wait-And-See Mode
Is A Time Of GBPJPY Weakness Ahead?

Comments
Log in or sign up to join the conversation.