
Is Nasdaq Inc Management Utilizing Shareholder Equity Efficiently?
Nasdaq Inc (NDAQ) delivered an above average 13.0% ROE over the past year, compared to the 8.3% return generated by the Financials sector. Nasdaq's results may indicate management is running an efficient business relative to its peers, which may very well be the case, but it is important to understand what ROE is made up of and how it should be interpreted. Knowing these components may change your view on Nasdaq's performance and future prospects. I show you exactly what I mean in my DuPont analysis below.
How To Calculate Nasdaq's ROE
Return on equity measures a corporation's profitability by revealing how much profit a company generates with the money shareholders have invested. Return on Equity or ROE is generally calculated using the following formula:
ROE = Net Income To Common / Average Total Common Equity
ROE is a helpful metric that illustrates how effective the company is at turning the cash put into the business into gains or returns for investors. However, it is important to note that ROE can be "manufactured" by management with the use of leverage or debt.
The return on equity achieved by Nasdaq over the last few years is shown below.
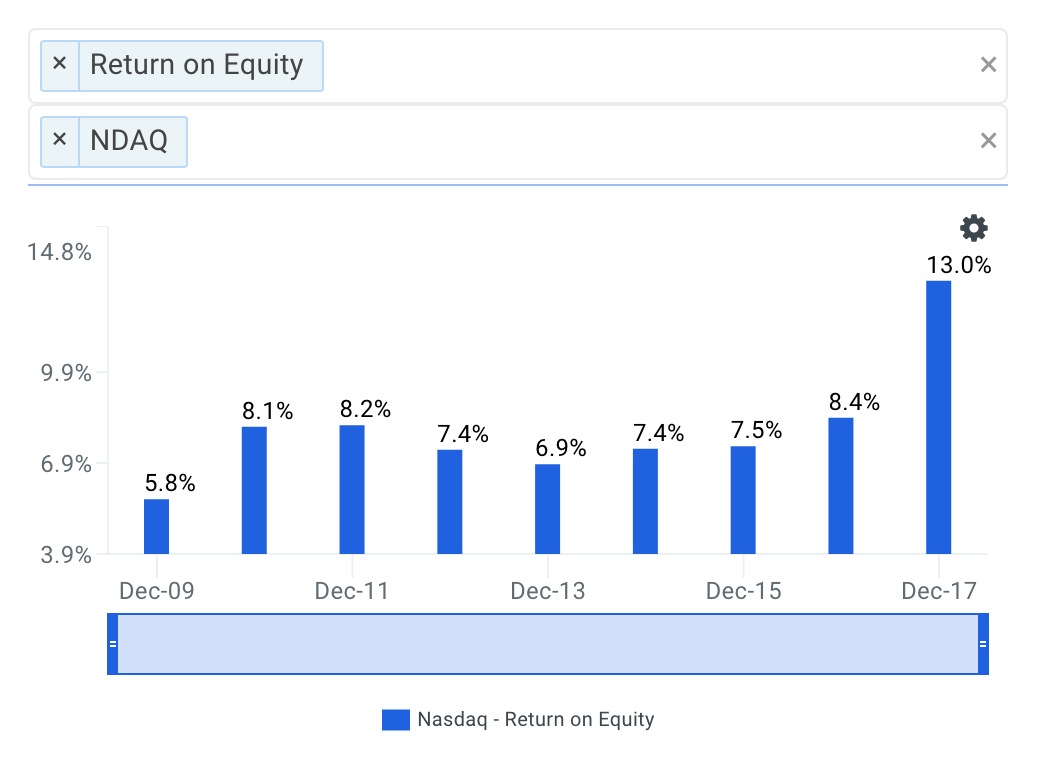
source: finbox.io data explorer - ROE
It appears that the return on equity of Nasdaq has generally been increasing over the last few years. ROE increased from 7.5% to 8.4% in fiscal year 2016, increased to 13.0% in 2017 and the LTM period is also its latest fiscal year. So what's causing the general improvement?
Understanding Nasdaq's Improving Return On Equity
The DuPont analysis is another way to calculate a company's ROE using the following three metrics:
Return on Equity = Net Profit Margin * Asset Turnover * Equity Multiplier
Analyzing changes in these three items over time allows investors to figure out if operating efficiency, asset use efficiency or the use of leverage is what's causing changes in ROE. Strong companies should have ROE that is increasing because its net profit margin and/or asset turnover is increasing. On the other hand, a company may not be as strong as investors would otherwise think if ROE is increasing from the use of leverage or debt.
So what exactly is causing Nasdaq's improving returns?
Net Profit Margin Trends
It appears that the net profit margin of Nasdaq significantly improved in 2017. Margins increased from 12.6% in fiscal year 2016 to 18.5% in 2017!
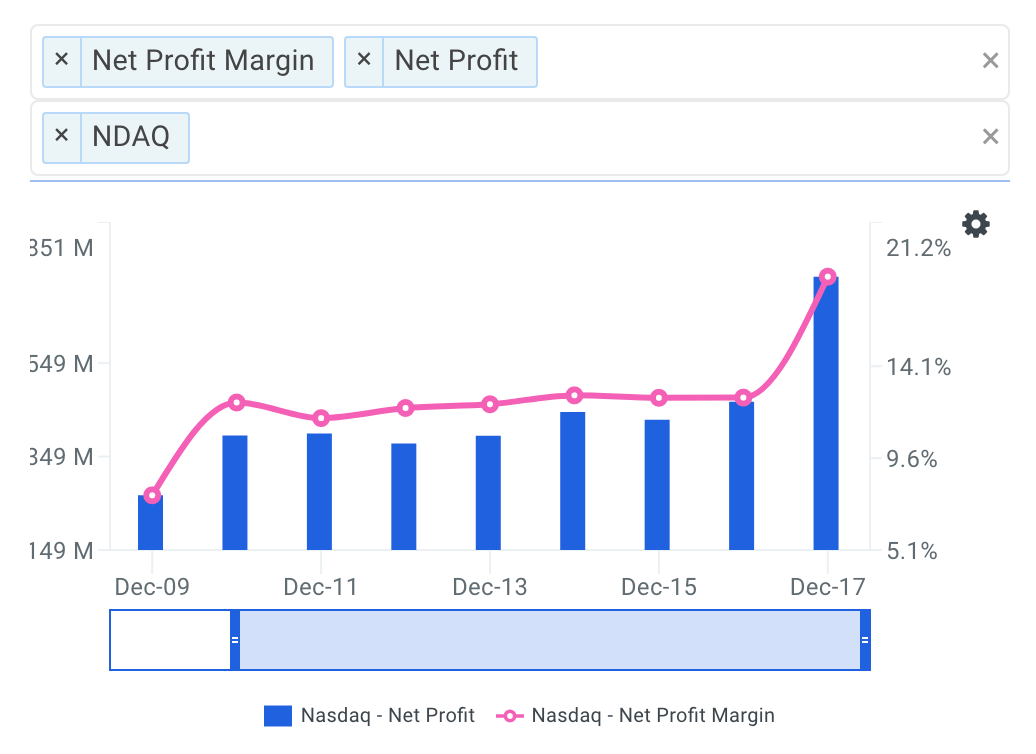
source: data explorer - net profit margin
Therefore, the company's increasing margins help explain, at least partially, why ROE is also increasing. Now let's take a look at Nasdaq's efficiency performance to see if that is also boosting ROE.
Asset Turnover Trends
It appears that asset turnover of Nasdaq has generally been declining over the last few years.
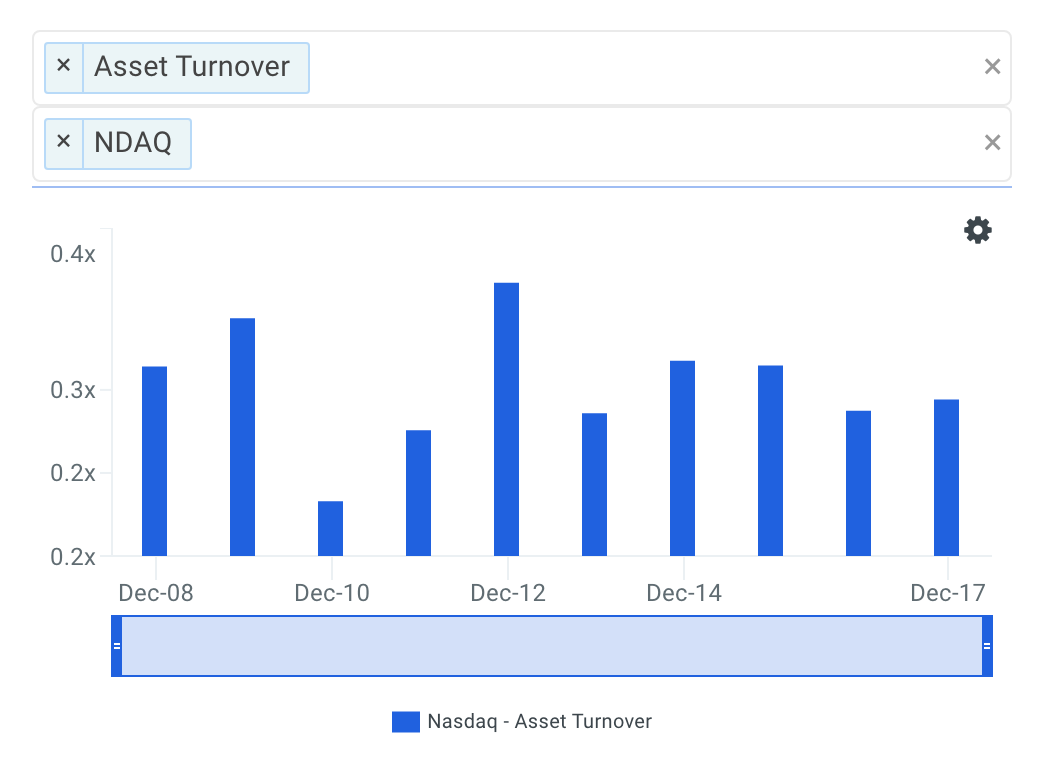
source: data explorer - asset turnover
Therefore, the company's ROE improvement is not as a result of its asset turnover performance which has generally been decreasing.
Finally, the DuPont constituents that make up Nasdaq's ROE are shown in the table below. Note that the table also compares Nasdaq to a peer group that includes Intercontinental Exchange Inc. (NYSE: ICE), S&P Global Inc. (NYSE: SPGI), FactSet Research Systems Inc.(NYSE: FDS) and MSCI Inc (NYSE: MSCI).
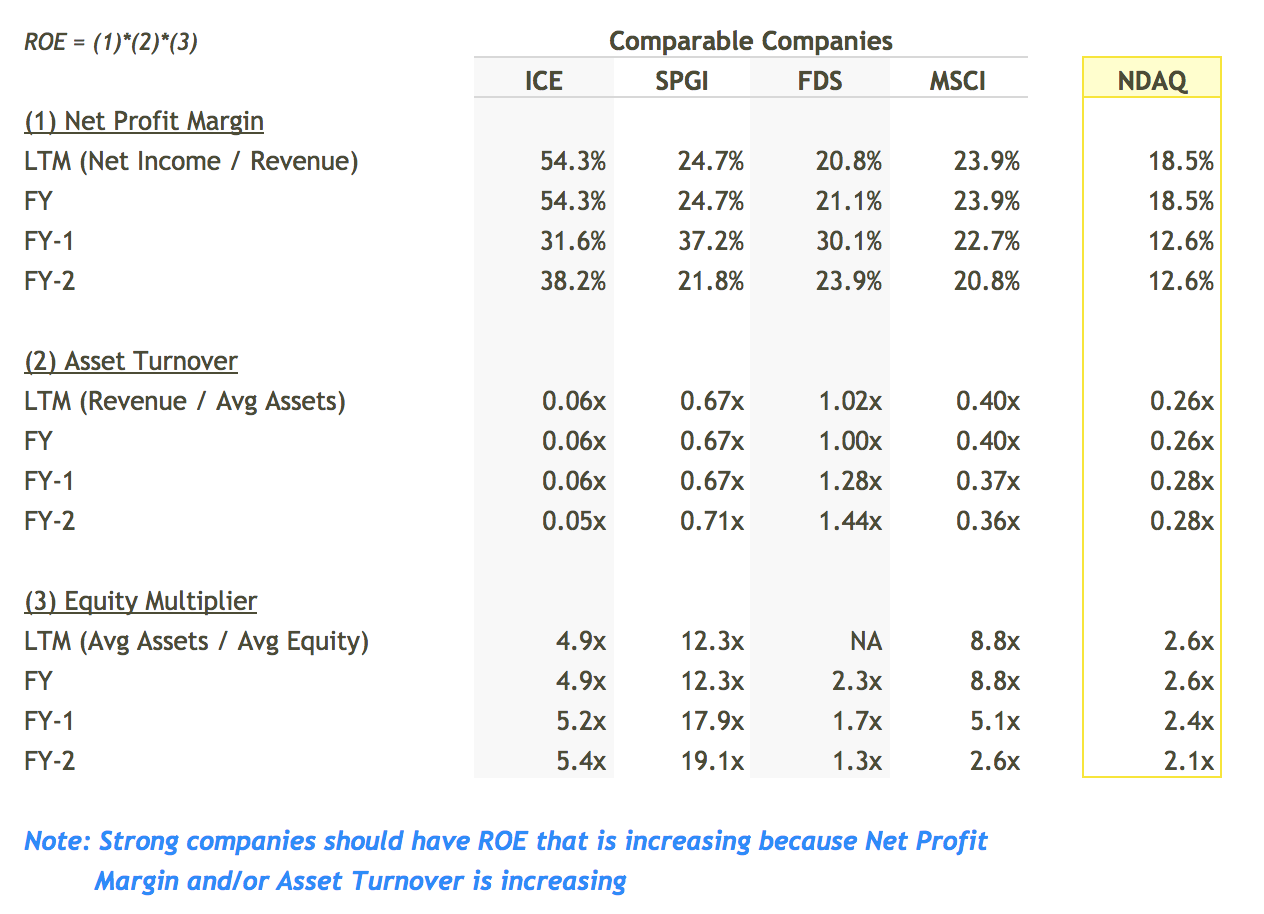
source: finbox.io's DuPont model
In conclusion, the DuPont analysis has helped us better understand that Nasdaq's general improvement in return on equity is the result of an improving net profit margin, a declining asset turnover ratio and increasing leverage. Therefore when looking at the core operations of the business, Nasdaq shareholders may need to start worrying due to the company's general decline in operational efficiency and increasing leverage.
The DuPont approach is a helpful tool when analyzing how well management is utilizing shareholder capital. But before making an investment decision, I recommend you continue to research Nasdaq to get a more comprehensive view of the company by looking at:
Risk Metrics: what is Nasdaq's CapEx coverage? This is the amount a company outlays for capital assets for each dollar it generates from those investments. View the company's CapEx coverage here.
Forecast Metrics: what is Nasdaq's projected EBITDA margin? Is the company expected to improve its profitability going forward? Analyze the company's projected EBITDA margin here.
Efficiency Metrics: is management becoming more or less efficient in creating value for the firm? Find out by analyzing the company's return on invested capital ratio here.
Disclosure: As of this writing, I did not hold a position in any of the aforementioned securities and this is not a buy or sell recommendation on any security mentioned.
Andy is also a ...
more


As long as it is generating enough profits to pay off its debt and is growing its debt accumulation is not a major concern yet. Of course, some companies add so much debt it is a major concern, but this is not the case here. Eventually when it pays down the debt their profitability will look that much better.