

Image Source: Pexels
When a major stock like Oracle (ORCL) pulls back 31% from its all-time highs, traders take notice. For many, a significant drop like this spells trouble. But for the disciplined trader, it can signal a prime opportunity. The key is to understand where the stock might find its footing, and right now, Oracle is testing a critical support level that could define its next major move.
While this steep decline in Oracle has been dramatic for those holding the stock, its impact on the broader market, like the S&P 500 (SPY) or Nasdaq 100 (QQQ), has been surprisingly minimal. This tells me the selling pressure is largely specific to ORCL, not a sign of widespread market panic. For traders, this isolation is a good thing and it means we can analyze the stock on its own technical merits without as much noise from overall market sentiment.
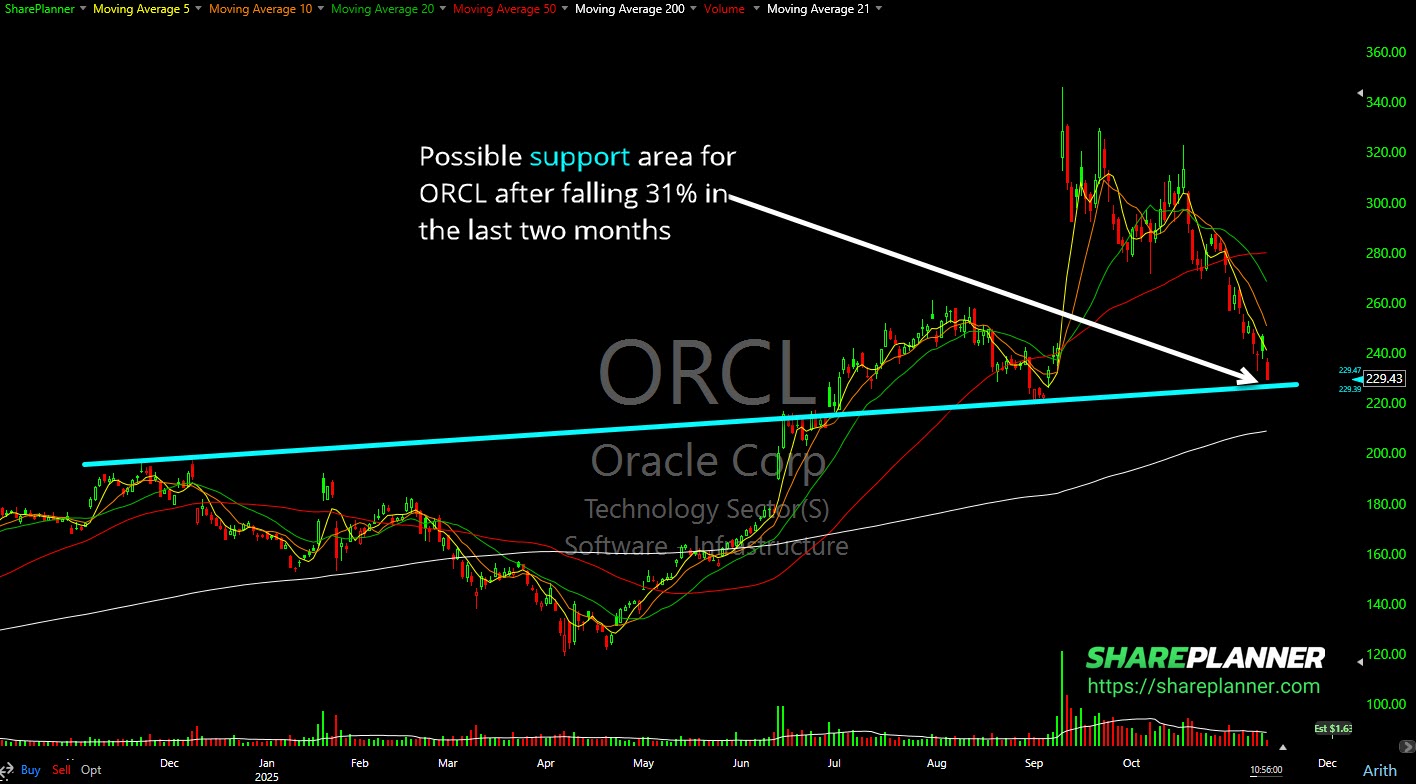
As you can see from the chart below, after peaking near $340 in October, the stock has been in a freefall. But it is now approaching a key support area around the $229 level. This isn’t just a random price; it’s a level where buyers have previously stepped in, creating a potential floor for the stock.
(Click on image to enlarge)
How to Trade This ORCL Setup
When a stock tests a key support level, there are a few ways to approach it. The goal isn’t to perfectly time the bottom as that is a losing game. Instead, we want to see confirmation that buyers are stepping back in and that the support level is holding strong.
Here are a few things to watch for:
- A Bounce Off Support: The most straightforward signal is seeing the stock price hit the support level (around $229) and then bounce higher. We’re not looking for a massive rally right away. A solid close above support for one or two days can be enough to show that the selling pressure is easing.
- Increased Buying Volume: Pay attention to the volume bars at the bottom of the chart. A bounce on low volume isn’t very convincing. What we want to see is a spike in buying volume as the stock tests support. This indicates that large institutions and other serious buyers are accumulating shares at this level, giving the support more credibility.
- Bullish Candlestick Patterns: Look for patterns like a “hammer” or a “bullish engulfing” candle right at the support level. These patterns can signal a potential reversal and show that buyers have successfully defended the price level during the trading day.
Managing risk is always the top priority. If you decide to take a long position here, your stop-loss should be placed just below the key support level. Why? Because if the stock breaks decisively below that floor, it’s a clear sign that the downtrend is likely to continue, and you want to get out with a small, manageable loss. Hoping for a recovery once key support is broken is how traders get into deeper trouble.
The Bigger Picture on ORCL
Oracle’s 31% decline is a significant event, but it’s not a reason to panic. For swing traders, volatility is where opportunities are born. The stock is now at a critical juncture, testing a support level that could serve as the launchpad for a new rally.
I’m not jumping in just yet. I want to see the stock prove itself. I’ll be watching for a confirmed bounce off support, backed by strong volume, before considering a long trade. If that happens, this could be one of the best dip-buying opportunities we’ve seen in a while. If it fails, we stay on the sidelines and protect our capital. It’s that simple.
More By This Author:
ORCL Bounce?
Using Top-Down Analysis For JNJ Trade Setup
PLTR Back To Breakout Support


Comments
Log in or sign up to join the conversation.