

Image Source: Pexels
Highlights:
- The approximate entropy test enables us to identify when deterministic chaotic patterns start emerging in financial assets.
- The S&P 500 index and its ETF SPDRs have non-linear dependence patterns in the 3-day interval.
- The I Know First AI algorithm allows for identifying non-linear dependencies in financial assets to find the most promising investment opportunities.
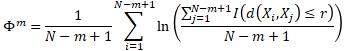
The basic element of the information theory is an entropy concept. Entropy is a measurement of uncertainty in some situations. Moreover, entropy is independent of the type of distribution. The uncertainty, as measured by entropy, can be determined as the average number of questions with “yes” or “no” answers which need to determine the value of the random variable. If we assume a coin, we have a 50% probability of determining the value of the random variable (head or tail) from the first question, and our questioning stops. In the other cases, we are required to ask again. Entropy represents the average number of binary yes/no questions. The higher the entropy, the higher the uncertainty, and the more questions we need to ask to determine the correct answer.
In general, randomness is defined as a lack of patterns. We would say that a market is somehow predictable if it always follows the same price patterns and totally random if there is no repetition of the patterns and the participants buy or sell without any way to determine their next move. While entropy is a measurement of disorganization, the information determines a measure of certainty. Approximate entropy allows us to detect dependencies and deterministic chaotic patterns in financial time series.
The advantage of the approximate entropy test is that it can be successfully implemented in small samples. This test enables us to identify regularity in binary signals (price goes up or goes down) and determine if financial asset returns exhibit some non-linear dependence. The entropy test is based on the information theory and the test measures the amount of information that each new observation releases to the observer. We can compare the amount of information, or at least approximate, that one additional observation of our series releases to us, and compare it to the amount of information that we would obtain from a purely independent or random series.
For instance, the entropy of a fair coin toss is one bit, or in logarithmic entropy that would be log 2 because we have no pressure position what is more likely to happen before the toss – it is a head or it is a tail. Similarly, we can apply the same logic to stock returns and code them zero and ones regarding their particular patterns.
(Equation 1: The Indicator Function)

(Equation 3: The Entropy Test)
We try to mimic the logic of theoretical entropy by calculating the indicator function in Equation 1 which is equal to 1 if observations are close apart and zero if they are far apart from the median return distance. Equation 2 is the difference between values of the aggregated correlation integrals between different embedding dimensions. It allows us to proxy the approximate entropy. Equation 3 allows us to calculate the difference between the entropy which we observe in our data and the entropy that we would observe if the data were perfectly random that is the entropy of a coin toss. We assume that our entropy would be equal to or less than the entropy of a coin toss or in our case the median return distance.
Let us implement the approximate entropy test and estimate where the S&P500 and sector ETF SPRDs exhibit non-linear dependence.
| Asset | Description |
| S&P500 | Tracking the stock performance of 500 large companies listed on stock exchanges in the United States. |
| XLF | XLF tracks an index of S&P 500 financial stocks, weighted by market cap. |
| XLI | XLI tracks a market-cap-weighted index of industrial-sector stocks drawn from the S&P 500. |
| XLK | XLK tracks an index of S&P 500 technology stocks. |
| XLV | XLV tracks healthcare stocks from within the S&P 500 Index, weighted by market cap. |
| XLB | XLB tracks a market-cap-weighted index of US basic materials companies. The fund includes only the materials components of the S&P 500. |
| XLP | XLP tracks a market-cap-weighted index of consumer-staples stocks drawn from the S&P 500. |
| XLU | XLU tracks a market-cap-weighted index of US utility stocks drawn exclusively from the S&P 500. |
| XLE | XLE tracks a market-cap-weighted index of US energy companies in the S&P 500. |
| XLY | XLY tracks a market-cap-weighted index of consumer-discretionary stocks drawn from the S&P 500. |
| XLRE | XLRE tracks a market-cap-weighted index of REITs and real estate stocks, excluding mortgage REITs, from the S&P 500. |
We implement the approximate entropy test by using 100 observations of series returns for the period from September 22, 2022, to February 15, 2023. The number of stages is equal to 2, if an observation has a distance return close to the median distance return, it gets to stage 1, and 0 otherwise. Below, we can notice entropy evaluations for different lags, where m=2 is the 1-day lag, m=3 is the 2-day lag and etc.

According to Table 1, we cannot estimate the p-value for the dimension of 2 because Equation 3 does not allow us to correctly approximate the Chi-square, which gets negative numbers. Therefore, we cannot say that there are non-linear dependences or deterministic chaos in the dimension of 2. If we change to the dimension of 3, we can conclude that there are non-linear dependency patterns in the S&P500, XLF, XLI, XLP, and XLU with a confidence of 95%. Moreover, all assets have non-linear dependence patterns for the dimension of 4 or 3 days with a confidence of 95%.
Ordering Chaos in the Stock Market
The I Know First AI algorithm allows for identifying non-linear dependencies in financial assets to find the most promising investment opportunities. Having non-linear dependencies in financial data series tells us that implying sophisticated strategies enables an investor to systematically beat the market and extract additional profit from its investment positions. Previously in our articles, we discussed market chaos, the conceptual framework of applying ML and AI models to analyze and forecast financial assets, and we examined the presence of long-term memory in world stock market indices and the chaotic behavior of the S&P500 index in the pandemic time.
The I Know First predictive algorithm is a successful attempt to discover the rules of the market that enable us to make accurate stock market forecasts. Taking advantage of artificial intelligence and machine learning and using insights into chaos theory and self-similarity (the fractals), the algorithmic system is able to predict the behavior of over 13,500 markets. The key principle of the algorithm lies in the fact that a stock’s price is a function of many factors interacting non-linearly. Therefore, it is advantageous to use elements of artificial neural networks and genetic algorithms. How does it work? At first, an analysis of inputs is performed, ranking them according to their significance in predicting the target stock price. Then multiple models are created and tested utilizing 15 years of historical data. Only the best-performing models are kept while the rest are rejected. Models are refined every day, as new data becomes available. As the algorithm is purely empirical and self-learning, there is no human bias in the models and the market forecast system adapts to the new reality every day while still following general historical rules.
I Know First has used algorithmic outputs to provide an investment strategy for institutional investors. Below you can see the investment result of our S&P 500 Stocks package which was recommended to our clients for the period from January 1st, 2020 to February 15th, 2023 (you can access our forecast packages here).

The investment strategy that was recommended by I Know First accumulated a return of 78.93%, which exceeded the S&P 500 return by 50.04%.
Conclusion
The appropriate entropy test enables us to identify the existence of non-linear dependencies in different dimensions of financial data series. We have estimated approximate entropy for the S&P500 and its ETF SPDRs and we have noticed that all of them have non-linear dependence patterns for the dimension of 4 or 3 days. Consequently, implementing sophisticated portfolio strategies by investors allows them to beat the market and extract additional profit.
More By This Author:
Market Anomaly: Weekend Effect Of Monday And Friday Stock Returns
Market Anomaly: January And April Effects
AI Stock Forecast: Fighting The Irrational Crowd By Investing Through AI


Comments
Log in or sign up to join the conversation.