Iceland´s Equity Indexes At And Above Their 52-Week Highs

Image Source: Pexels
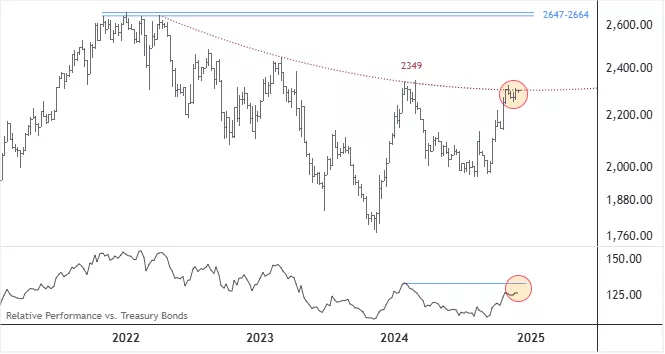
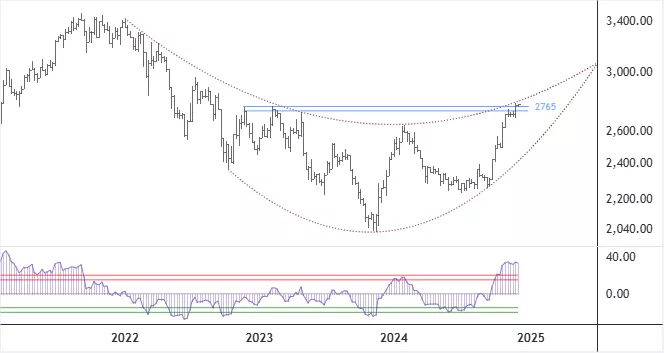
As I have mentioned before, it looks like the two stock market indices in Iceland, OMXIPI and OMXI15, are in the process of reversing their long-term trends to the upside. Both are forming or have formed some type of potential cup-and-handle or inverse head-and-shoulder patterns. The former is close to its 52-week (one-year) high, while the latter took out its 52-week high a while ago.
OMXIPI needs to push convincingly up through 2349 and OMXI15 up through 2765, and stay thereabove, to confirm that a reversal has taken place. I also want to see the OMXIPI start to outperform the Treasury bond index (NOMXIBB), with the ratio between the two rising above its 2024 high level.
If we get a convincing breakout in the indexes, then I believe there is a good chance for them to rise much further with the highs from late 2021 and early 2022 as the next possible targets.
The rolling returns of the indices have also become positive.
OMXIPI – Weekly Chart

OMXI15 – Weekly Chart
(Click on image to enlarge)

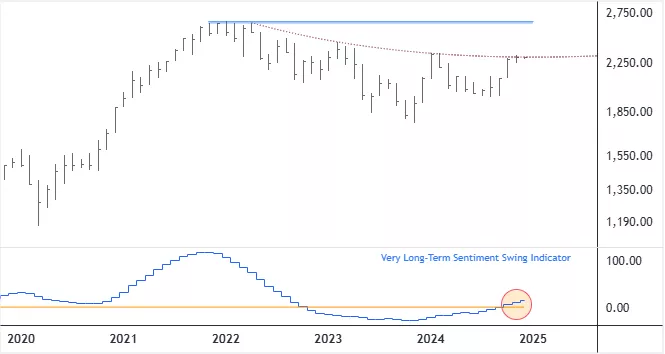
My third chart shows the OMXIPI with my very long-term Sentiment Swing Indicator (SSI) in the lower window. A buy signal was triggered in the SSI in January of this year and since then the SSI has been rising. Need to see if the Index can take out its January/February 2024 highs. A monthly close below 2,031.45 would flip the SSI from up to down.
OMXIPI – Monthly Chart
(Click on image to enlarge)

More By This Author:
Stock Market Indices In Iceland At Key Inflection Points
Share Prices Of Two Icelandic Banks Improving
Return Of OMXIPI On A Cyclical Upturn
Disclosure: The author of the analysis presented here does not own shares or have a position or other direct or indirect monetary interests in the financial instrument or product discussed in his ...
more


