
HSBC Casts Doubt On OpenAI’s Future
Per the Financial Times (LINK), HSBC has serious doubts about OpenAI’s financial wherewithal. The following bullet points outline HSBC’s assumptions, which highlight the challenging financial path OpenAI faces.
- OpenAI recently committed to renting up to four additional gigawatts of cloud computing space from Microsoft and Amazon, bringing its total contracted power to 36GW
- Based on all its known data center rental deals, including recent agreements with Microsoft, Oracle, CoreWeave, and Amazon, OpenAI’s rental expenses will total up to $1.8 trillion. HSBC forecasts that this will translate into roughly $620 billion in annual rental costs upon full deployment.
- Even with extremely bullish usage assumptions including (3 billion users or 44% of the worlds adult population by 2030, 10% of users having paid subscriptions, revenues from search and advertising revenue, and strong enterprise growth) OpenAI’s projected cumulative free cash flow through 2030 reaches only about $282bn, far short of the cumulative $792bn in rental costs HSBC expects over the same period
- After adding Nvidia’s promised investments, existing cash, and undrawn financing facilities, HSBC still sees a $207 billion funding gap through 2030, meaning OpenAI will need repeated significant capital raises to keep operating its rented data centers.
The graphic below from the article shows that HSBC expects OpenAI to run a massive operating loss in the year 2030. Accordingly, they have serious concerns about OpenAI’s ability to raise enough capital to carry them through to the time when, or if, they become profitable. Despite HSBC’s sour view of OpenAI, they are very bullish on AI’s prospects, as we share below from the article.
Some AI assets may be overvalued, some may be undervalued too. But eventually, a few incremental basis points of economic growth (productivity-driven) on a USD110trn+ world GDP could dwarf what is often seen as unreasonable capex spending at present.

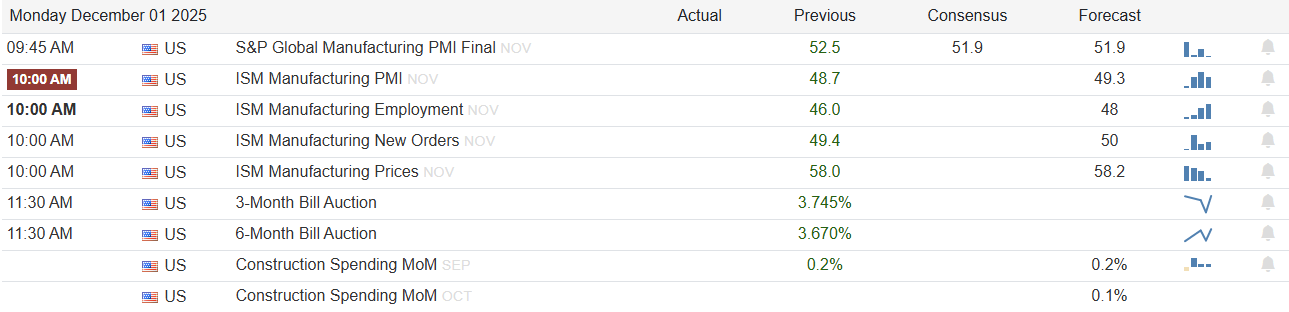
What To Watch Today
Earnings
- No notable earnings releases
Economy
Market Trading Update
Over the last few weeks, we discussed the risk of downside pressure in the market and that the correction set up potential for a rally during the holiday-shortened trading week. That occurred with the S&P 500 rising roughly 3.7% from last Friday’s close near 6,849. That rebound recaptured the losses from the prior AI- and rate-cut-wobble selloff and pushed the index back toward its late-October highs. On a bigger picture basis, the index remains up around 16% year-to-date and is now roughly flat for November, reflecting a strong tape that has simply been digesting earlier gains.
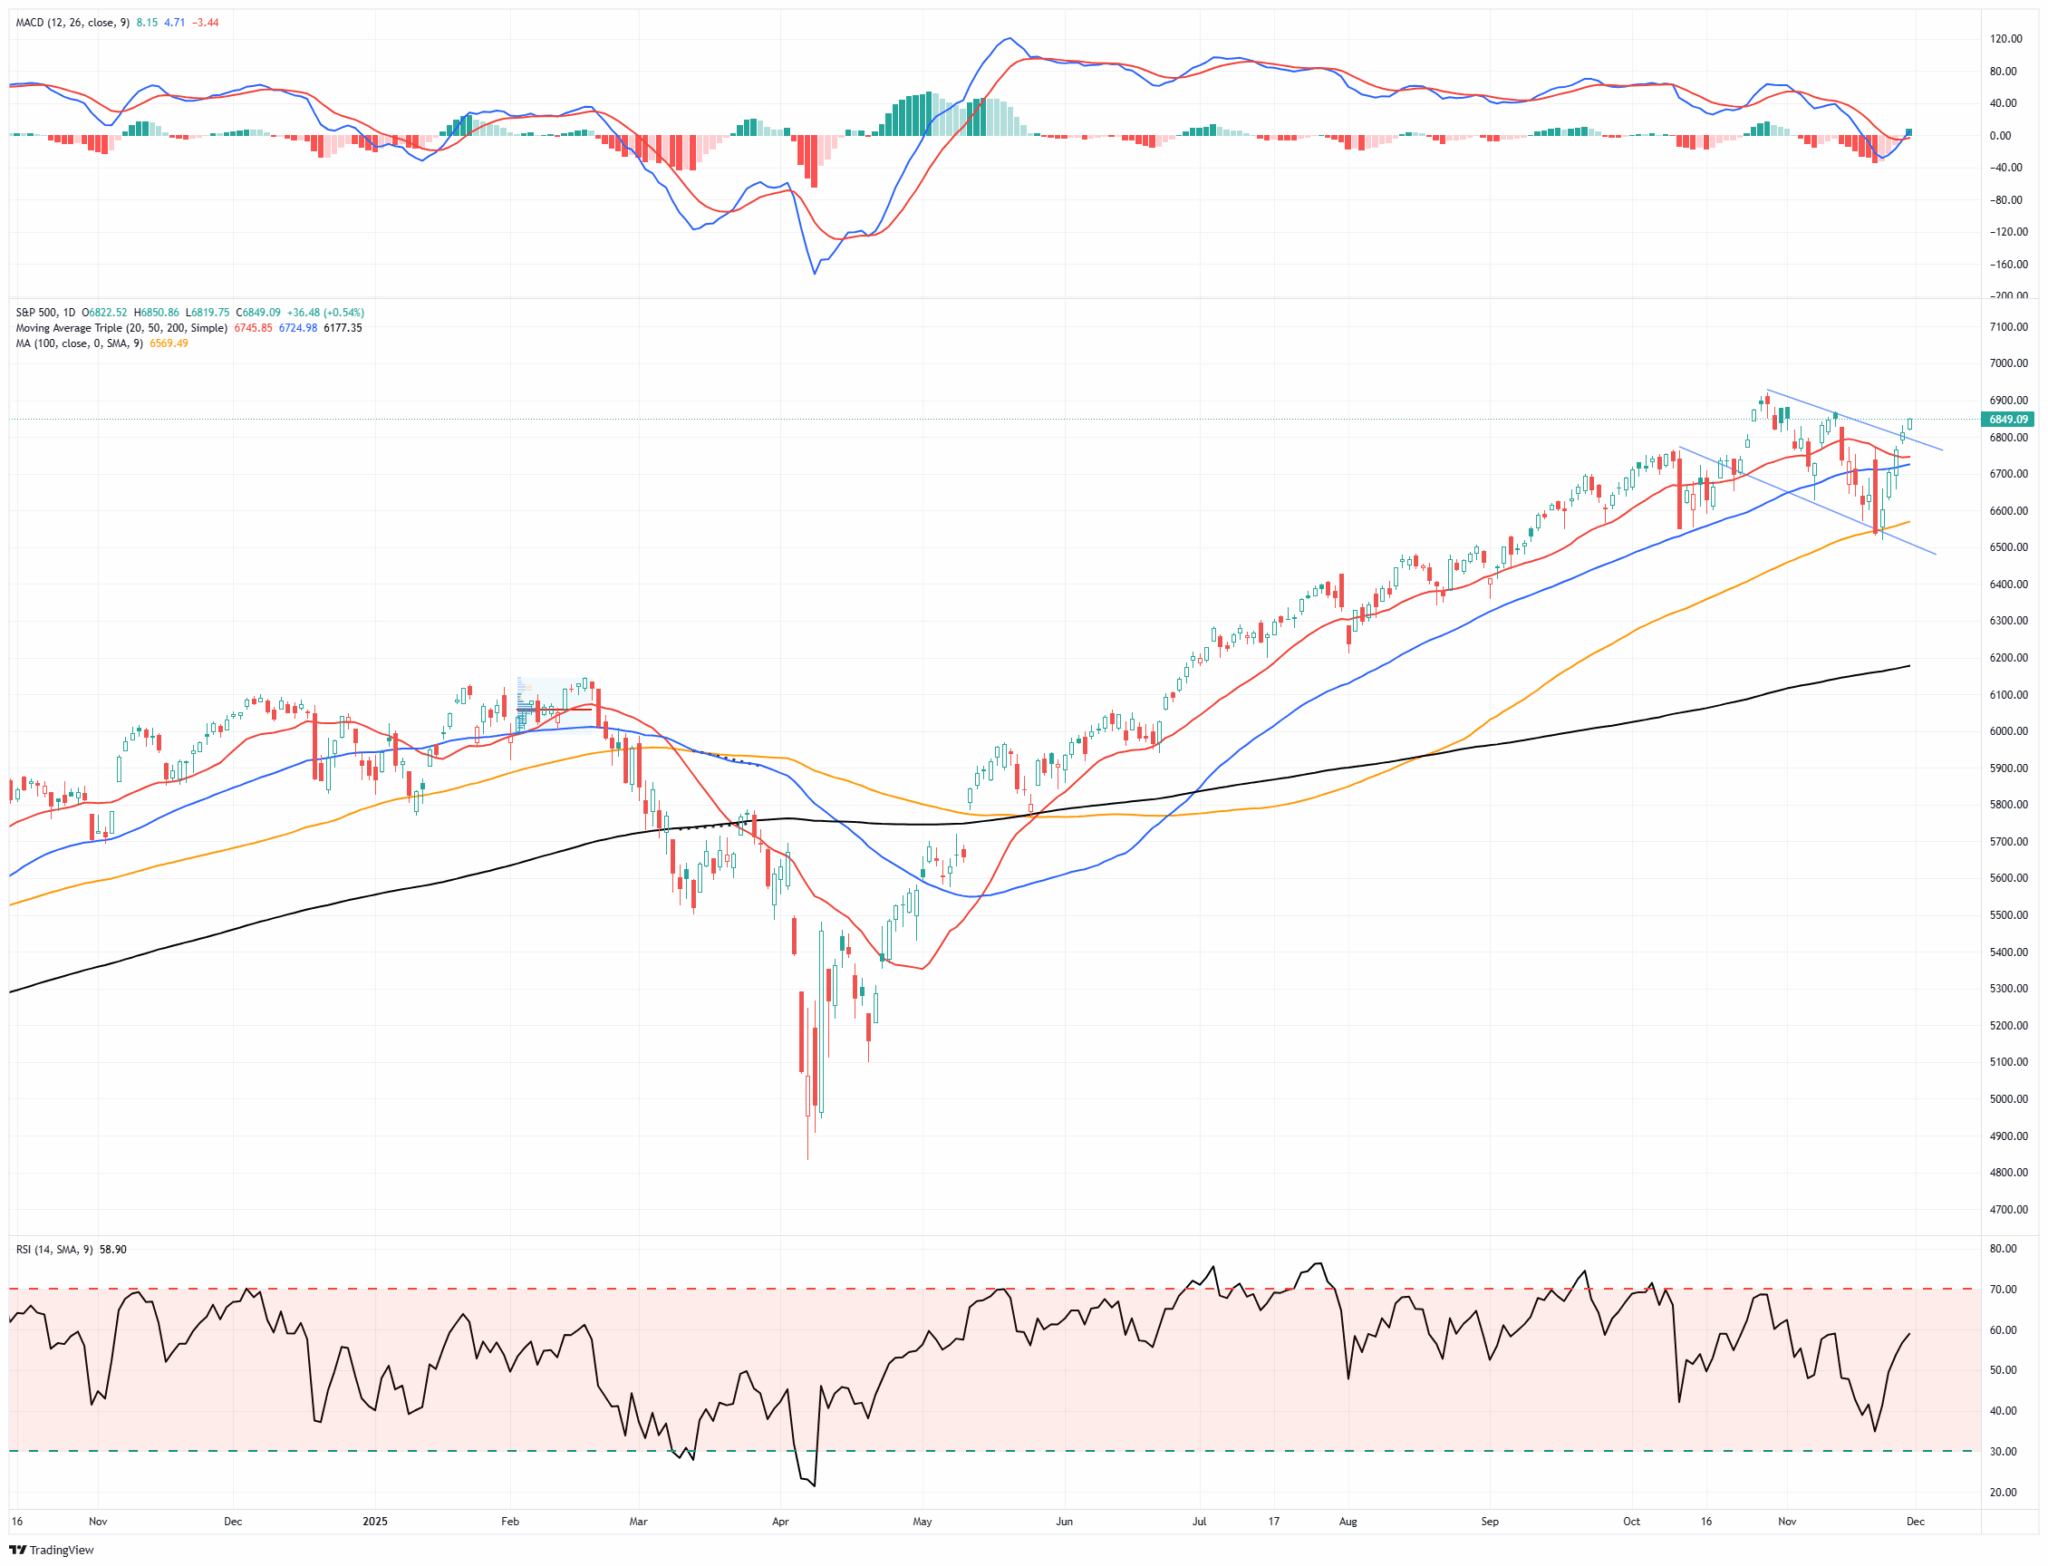
From a trend standpoint, the price remains aligned with the bulls. The S&P is trading above its rising 50- and 100-day moving averages, which sit roughly in the 6,700–6,575 zone, and well north of the 200-day moving average near 6,175. Earlier in November, the index finally broke its streak above the 50-day moving average (DMA) and corrected back to the 100-DMA, working off some of the speculative excess in AI and high-beta names. This week’s bounce off that support pulled the price back into the upper half of its recent trading range, keeping the primary uptrend intact.
Volatility has cooled but not disappeared. After spiking into the upper 20s during the recent tech/AI downdraft, the VIX slid back into the high teens, around 16, by Friday’s close, signaling that the panic bid for protection is fading but that investors are not yet entirely complacent. That’s consistent with a market transitioning from a “shot across the bow” correction to a more typical year-end positioning grind.

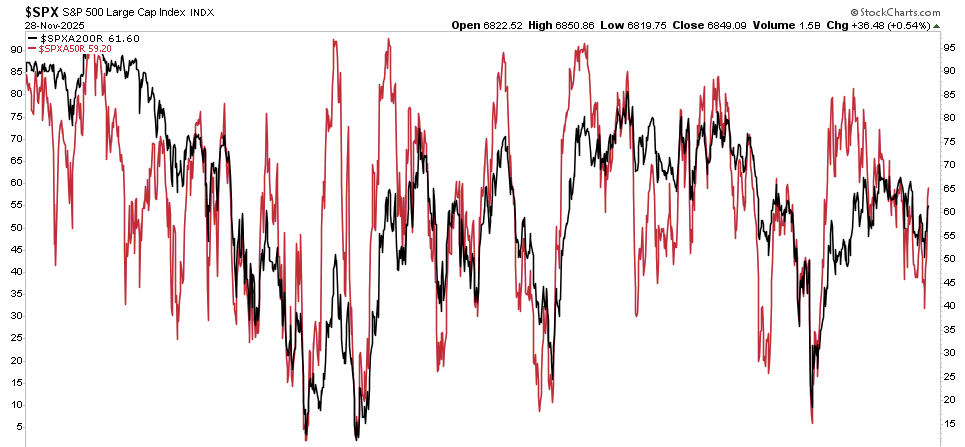
Breadth is improving, but it isn’t a blow-out green light. Roughly 59% of S&P 500 stocks are back above their 50-day moving averages, and just over 61% trade above their 200-day, a solid improvement from the trough earlier in the month but still shy of the 70%+ readings you’d expect in a truly broad-based rally. Participation has also expanded beyond mega-cap tech, with more cyclical and value names stabilizing; however, leadership remains heavily tilted toward large-cap growth and AI-adjacent beneficiaries.
Bullish case heading into December: Seasonality, positioning, and trend still lean in favor of the bulls. December is historically one of the stronger months for equities, particularly when the market is already up by double digits year-to-date. Expectations for a December Fed rate cut, and a gradual cooling of inflation, support the “soft-landing” narrative, while corporate buybacks and under-invested managers create fuel for a “chase into year-end” if resistance gives way. With volatility easing and breadth improving, the path of least resistance near term remains higher if key support zones are maintained.
Bearish case heading into December: The bears will point out that valuations in AI and growth remain stretched, that volatility is still elevated compared to the summer lows, and that breadth, while improved, is not confirming a runaway advance. The recent episode, where AI leaders and other risk assets (including Bitcoin) sold off together, is a reminder that risk appetites can shift quickly when the crowd questions the durability of earnings or the timing of Fed cuts. Delayed economic releases from the earlier government shutdown create an additional wildcard: a batch of weaker-than-expected data hitting all at once could challenge the soft-landing narrative just as liquidity gets thinner into year-end.
Support and Resistance Levels
- Near-term support:
- ~6,725–6,750: cluster of short-term support at the 20 and 50-DMA
- ~6,569: last week’s support at the 100-DMA.
- Deeper support: ~6,175 (200-DMA) on any more serious risk-off move,
- Resistance:
- 6,867–6,909: Previous market tops in mid-October and early November.
- 7,000: psychological round-number magnet if momentum accelerates
- Volatility “line in the sand”:
- VIX back above ~22–23 would signal a renewed risk-off phase; sustained readings in the mid-teens would confirm a constructive backdrop for a “Santa Rally” push.
Bottom line: the primary trend remains bullish, but the margin for error is narrowing. As we enter the final month of the year, the bulls remain in control as long as the index holds above the 50-day moving average and breadth continues to improve. A failure back below the 6,600 area, especially if accompanied by a renewed spike in volatility and renewed AI/credit jitters, would shift the balance of risk toward a deeper consolidation rather than a clean “Santa rally” into year-end.
The Week Ahead
The ISM manufacturing and services sectors will provide updates on the state of the economy, including employment and price trends. Last week saw a surprising decline in the Chicago Purchasing Managers Survey to levels nearly as low as any seen since 2000. Will the ISM show a similar degradation in economic activity? To help answer that question, the graph below shows a strong correlation between the Chicago survey and the national ISM report. While correlated, the ISM survey has held up better over the last few years.
Also on the agenda this week will be Friday’s PCE prices index. This report will provide the Fed with an update on inflation, one of the few pieces of current government data to guide them during their December 10th FOMC meeting. Currently, the market assigns an 87% the Fed cuts rates at the meeting.

Tweet of the Day

More By This Author:
Year-End Rally BeginsThe K Shaped Economy In One Graph
Ray Dalio Says Sell: But Not Yet
Disclaimer: Click here to read the full disclaimer.


