
How To Trade The Next Top In The S&P 500
In my last post, "A Manic Stock Market Leaves Behind An Extreme August Drawdown", I demonstrated how the near oversold trading conditions created a buying opportunity yet left plenty of outstanding doubt about remaining upward momentum in the S&P 500 (SPY). In particular, a major top seems to be brewing in the S&P 500.
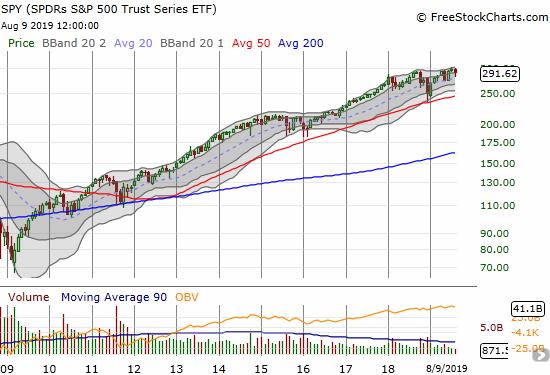
Source: FreeStockCharts
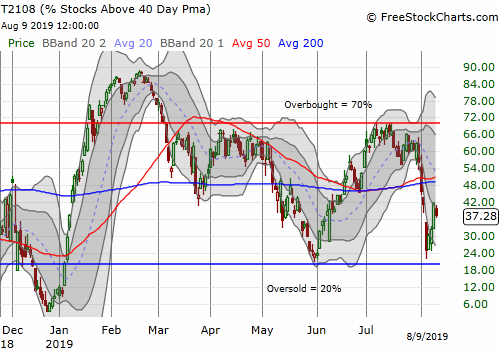
Given the market's struggles for the past 18-months, I decided to get even more methodical than usual about tracking the potential for topping patterns in the S&P 500. If a major top is indeed unfolding, one of the short to intermediate tops will transition into a very profitable setup for shorts (and exits from key investments). Three times this year, the percentage of stocks trading above their respective 40-day moving averages (DMA), also known as AT40 (T2108), topped out near 70%. After failing to challenge this threshold that I treat as an indicator of overbought trading conditions, I noted how a subsequent transition below 60% flagged an imminent and tradable pullback. Here is a summary:
- March 19: AT40 fell from 64.0% to 59.8%. The S&P 500 maximized its subsequent drawdown in 4 trading days at 1.2%
- April 9: AT40 fell from 66.4% to 58.4%. The S&P 500 maximized its subsequent drawdown on June 3rd at 4.6% AFTER the index first maximized a subsequent gain on April 30 at 2.3%.
- July 19: AT40 fell from 61.5% to 58.5%. The S&P 500 maximized its subsequent drawdown on August 5th at 4.4% AFTER the index first maximized a subsequent gain on July 26 at 1.7%.
As the market's relief rally unfolds, I will be watching for another failure of AT40 at the 70% threshold. Per my overbought strategy, I consider the market to be bullish as long as buyers exert enough power to keep AT40 in overbought territory. For a complete review of the definitions and implications of oversold and overbought readings from AT40, see my AT40 resource guide.


The S&P 500 is finally poised to hit an all-time high again. I posted here my thoughts on how to trade (short-term): drduru.com/.../t2108-update-190910/
Good article, thanks Dr. Duru!
Yes, indeed!