
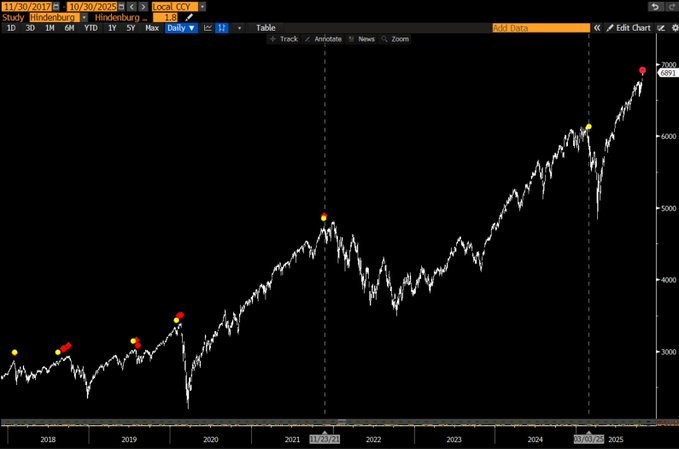
Last Wednesday, for the first time since November 2021, a Hindenburg Omen hit. This gauge is triggered when an upward trend is met with a growing number of stocks hitting both new 52-week highs and lows. Such indicates bad breadth, weakening momentum, and indecision. If all five conditions listed below are met, the indicator gives a yellow signal. If such an occurrence happens twice within a 36-day period, a Hindenburg Omen is triggered:
- Uptrend: The 50-day moving average of the NYSE Composite Index is above its 10-day moving average.
- New Highs Expansion: At least 2.2% of NYSE stocks hit new 52-week highs
- New Lows Expansion: At least 2.2% of NYSE stocks hit new 52-week lows
- Breadth Threshold: The lesser of new highs or new lows must exceed 2.8% of total NYSE issues.
- Momentum Break: The McClellan Oscillator (a breadth momentum tool) must turn negative.
The graph shows that over the last eight years, not all Hindenburg Omens (red) resulted in significant drawdowns; however, an Omen accurately preceded the steep pandemic decline in 2020. While not shown, the Hindenburg Omen effectively warned of the twin peaks before the 2008 Financial Crisis and the Dotcom bubble top.
The analysis shown is on the NYSE Composite Index. Sentimentrader runs the same analysis on the S&P 500 and Nasdaq and finds that Omens become more concerning when a large cluster of signals forms over a short period. Their website notes that both the S&P 500 and the Nasdaq triggered a Hindenburg Omen last week.
Bottom line: market breadth is horrendous and will likely lead to a rotation favoring out-of-favor sectors and stocks. Thus, it’s not surprising that the Hindenburg Omen was triggered. If we continue to see more of these Omens, the threat of a drawdown grows.
What To Watch Today
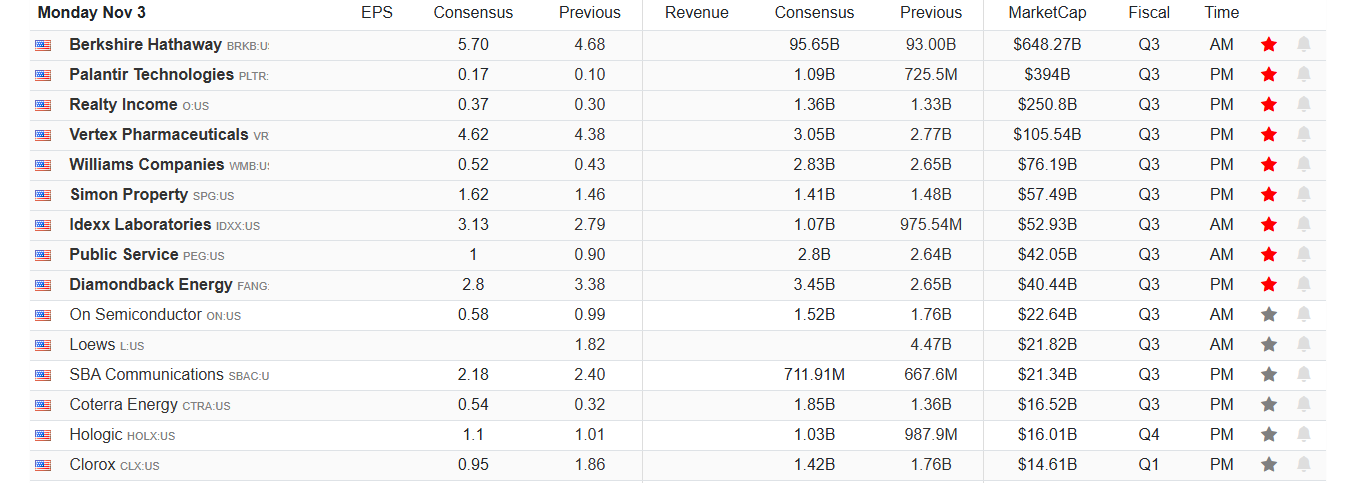
Earnings
Economy

Market Trading Update
Previous highs, following a successful test of the 50-day moving average (DMA), confirmed the continuation of the bullish trend. That move also reaffirmed support at key levels, particularly the running bullish trend line and the 20-DMA. The index remains above both the 50- and 200-day moving averages, both of which are trending higher, also supporting the bullish backdrop. Momentum has shifted positively, with the MACD triggering a fresh buy signal; however, there are concerns worth noting.
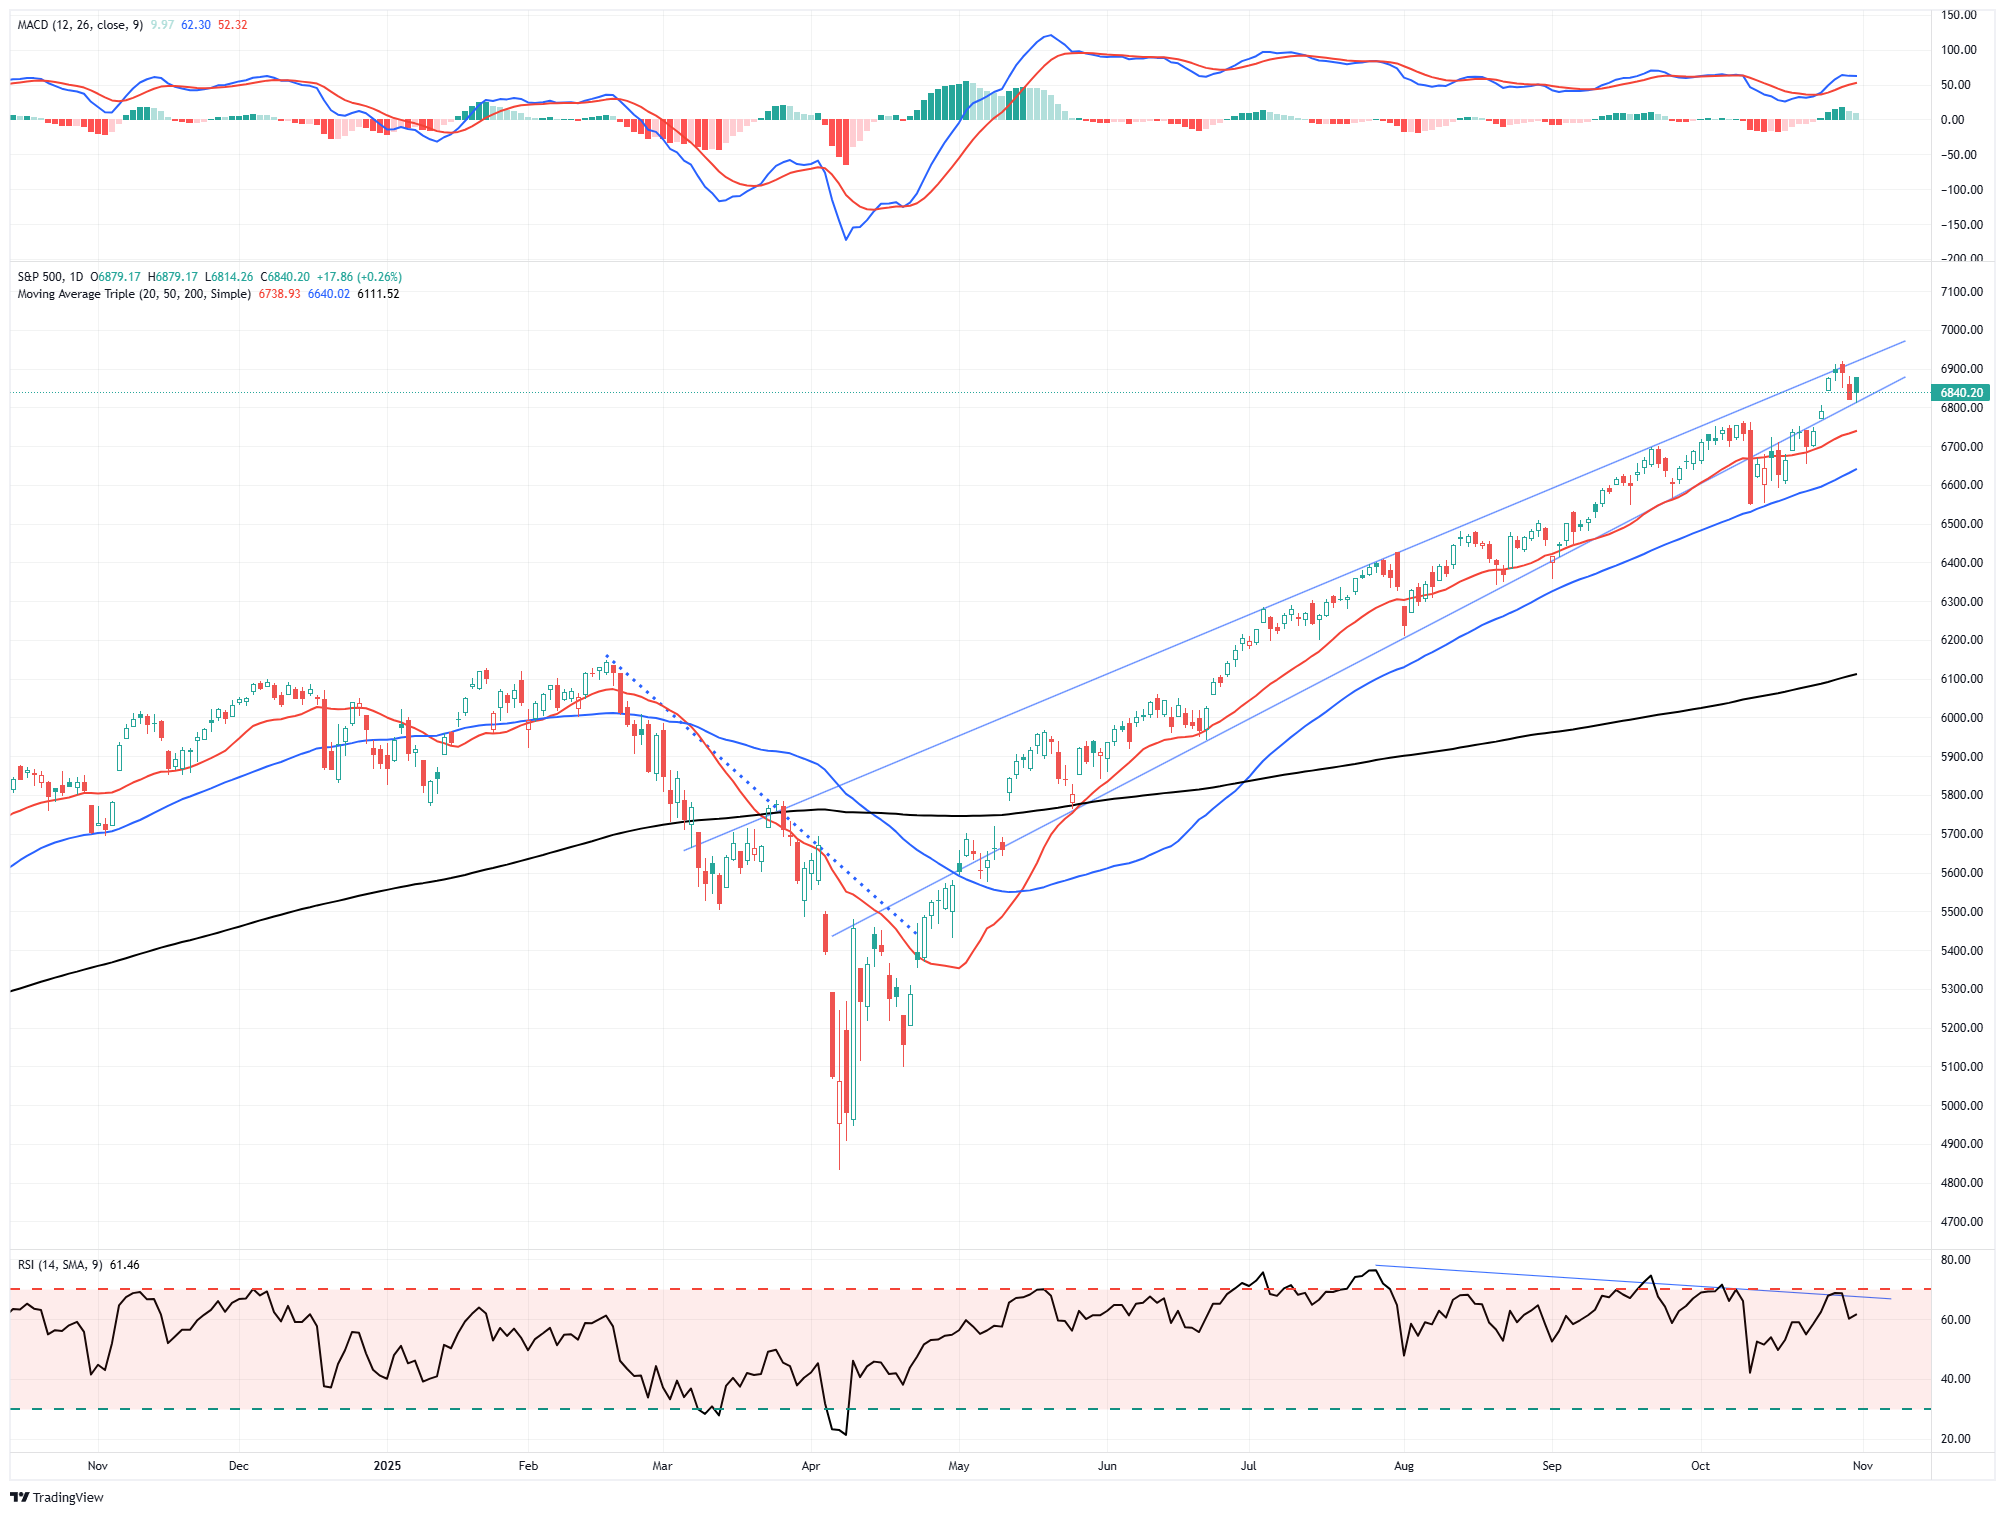
Breakouts to new highs typically draw in momentum buyers, yet this time has been different. Relative strength remains in a negative divergence to the S&P 500, and overall market breadth remains concerning. As shown, over the last week, the percentage of stocks in the S&P 500 index trading above their respective 50-, 75-, and 150-day moving averages has fallen sharply. Only 62.6% of S&P 500 components are trading above their 200-day moving average. That is a sharp decline from earlier this year and signals that fewer names are driving the rally. As price moves higher, participation narrows—a sign of fragility. The advance-decline line has also failed to confirm the new highs, flashing a classic divergence. Volume has been lighter on up days, adding to concerns about conviction.

Technically, this backdrop is bullish, but not strong. Breadth weakness, momentum divergence, and low-volume rallies suggest that the foundation beneath the breakout is thin. Price is moving higher, but without broad participation, the move becomes more vulnerable to sharp reversals.
Support and Resistance Levels:
- Resistance: ~6,850–6,900 (top of rising trend channel)
- First Support: ~6,740 (20-day moving average)
- Second Support: ~6,650 (50-day moving average)
- Crucial Support: ~6,100–6,200 (structural breakout level and 200-day moving average)
In this environment, investors should manage equity exposure with discipline. Participate in the trend, but stay alert. Without a broader base of participation, this rally could struggle to sustain momentum. If earnings and economic data don’t confirm price action, the risk of reversal will grow. Trim extended positions, tighten stops, and stay tactical.
The Week Ahead
After a lull in economic data, we get the ISM manufacturing and services surveys and the ADP labor report this week. The ISM surveys not only provide a broad economic sentiment reading but also break it down into subcomponents. Many investors will key on new orders as a gauge of future economic activity, along with prices and employment data. As we noted last week, ADP will now report its job gain/loss data weekly. Thus, after last week’s report of a 14k-job gain for the month ending October 11, we should expect a similar reading. However, this report will be its monthly report, which includes more details than its new weekly report.
The number of daily earnings reports will die down this week, but there are still a few important ones to follow. Included in this list are:
- Monday: Palantir and Williams
- Tuesday: AMD
- Wednesday: McDonald’s and Qualcomm
- Friday: Duke Energy
The Fed will be active on the speaking circuit and will hopefully provide more details on why they ended QT and their perceived monetary policy path ahead.
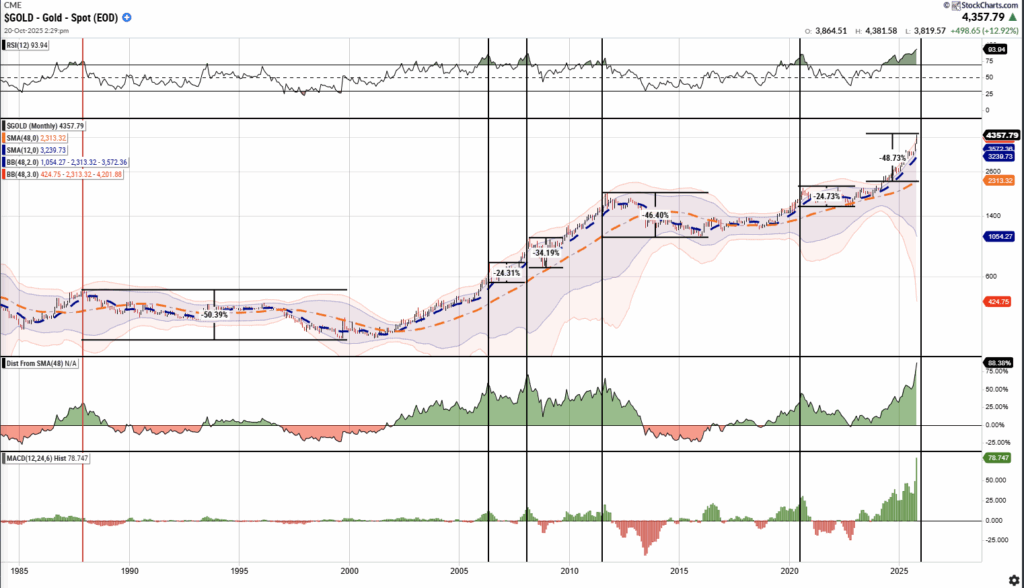
Gold Myths Luring Investors Into Risk
In case you haven’t heard, precious metals, particularly gold, have risen sharply this year. Of course, whenever any asset class experiences a more speculative melt-up, investors are quick to rationalize why “this time is different.” In stocks, it is about “artificial intelligence” and “data centers.” The cryptocurrency community believes all fiat currencies will fail and everything will move to the digital asset. But when it comes to gold, the voices have grown loudly, claiming the reasons for the rise are debasement of the dollar, de-dollarization, and soaring debt levels.
For example, Bloomberg lumped all three worries into one article.
“Beneath the surface of the short-term ups and downs of financial markets, a longer-term repricing of multiple assets may be underway as investors seek to protect themselves from the threats posed by runaway budget deficits.
Those who believe in it are pulling away from sovereign debt and the currencies they are denominated in, fearful their value will be eroded over time as governments avoid tackling their massive debt burdens and even seek to add to them.Further fuel is coming from speculation that central banks will face increasing political pressure to hold down interest rates to offset what governments owe — and in the process fan inflation by continuing to crank out cash.“
The problem with the Bloomberg article is that it was unresearched and just a recycling of already prevalent myths. In this article, we will go through each gold myth and present the data behind the analysis.
(Click on image to enlarge)
Tweet of the Day

More By This Author:
Fed QT Ends. What Does That Mean For Markets?Gold Myths Luring Investors Into Risk
Dow Theory: A Concerning Divergence Or Artifact?


Comments
Log in or sign up to join the conversation.