
Seasonal Weakness:
Stock Market: Weakest Month of the Year is September. Weakest week of the year is last week.
S&P 500 down ~22% ytd while earnings estimates down only ~3%. Analysts continue to call for a collapse in estimates like Q2.
Like June Lows: Expectations low into earnings season. +3.2% growth (low bar, expect upside surprise).
Federal Reserve:
Biggest Policy Mistakes of 110yr history of Federal Reserve:
Winston Churchill, “Generals are always prepared to fight the last war.”
Powell called inflation TRANSITORY when it was roaring and now wants to be Volker when it is collapsing.
Powell and Co. will have to walk-back their hawkishness (Like ECB, BoE, RBA) and here is why:
- Inflation already rolling over.
- Every 1% hike adds $285B/yr to the deficit in interest expense. Easy to hike rates when debt/gdp was 30% in 1980-1982. At 122%, not so much. They will inflate it away by running inflation above trend 3-5% for a few years just like post WWII.
- Credit markets will force their hand when governments, municipalities and companies can’t refinance. Already happened in Italy and UK.
Hawkish Talk/Guidance is working as 5yr inflation break-evens (proxy for inflation expectations) fell to 2.26% today (near 15 month low).
Managers Sentiment/Positioning for the Apocalypse:
Extreme readings such as these usually presage big turnarounds in the market:
–Highest expectations for Recession since Apr 2020 and March 2009 (stock market bottom was in in both cases).
-Allocations to cash highest since 2001 (6.1%). Higher than GFC and Pandemic Lows.
-Current AAII Sentiment Survey: 20% bullish. Pandemic Lows 20.23%. GFC lows 18.92%.
-If you can step in at extremes when volatility and fear are high, you will make outsized returns over time.
Take the other side. Looking out a few months, the “pain trade” is UP because no one is positioned for it.
US Mid-term election: Gridlock outcome is bullish for markets – no new taxes/spending/big regulation.
Follow the Smart Money:
–Short USD: Commercial Hedgers aggressively short (as was the case before peaks in 2020, 2017, 2015, 2013, 2009, 2006).
–Long US Treasuries 10 year note: Commercial Hedgers aggressively long (as was case before rally in bonds 2018, 2014, 2011, 2009)
–Long S&P Futures: Commercial Hedgers aggressively long (as was case before rally in equities 2020, 2016, 2011, 2009)
3 Picks:
- Boeing:
Finally received big order from China Airlines for up to 24 787 Dreamliners. Operates in duopoly. Demand/business travel roaring back. Earnings expected to grow at 20%/yr next 5 years. Big earnings growth next year off low baseline. Defense business will grow. Attractive valuation for business with a competitive moat.
- Alibaba (BABA) New Data on (Sum of Parts): Stock Bottomed in March.
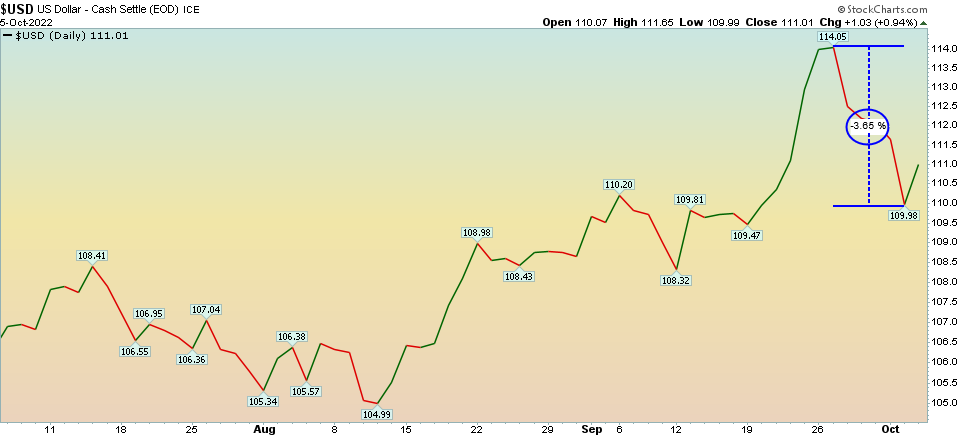
Last time we were on we said USD weakness would be the trigger for Emerging Market inflows. USD down 3.65% in last few sessions. This is big for Emerging Markets.
(Click on image to enlarge)
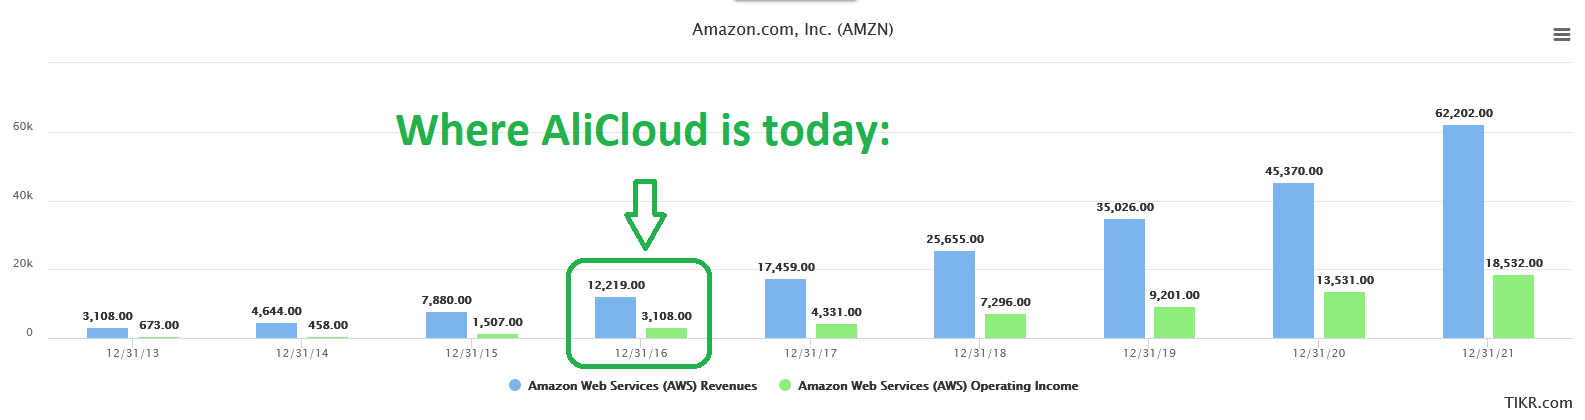
Alicloud 6 years behind AWS. Huge operating leverage as it scales:
(Click on image to enlarge)
(Click on image to enlarge)
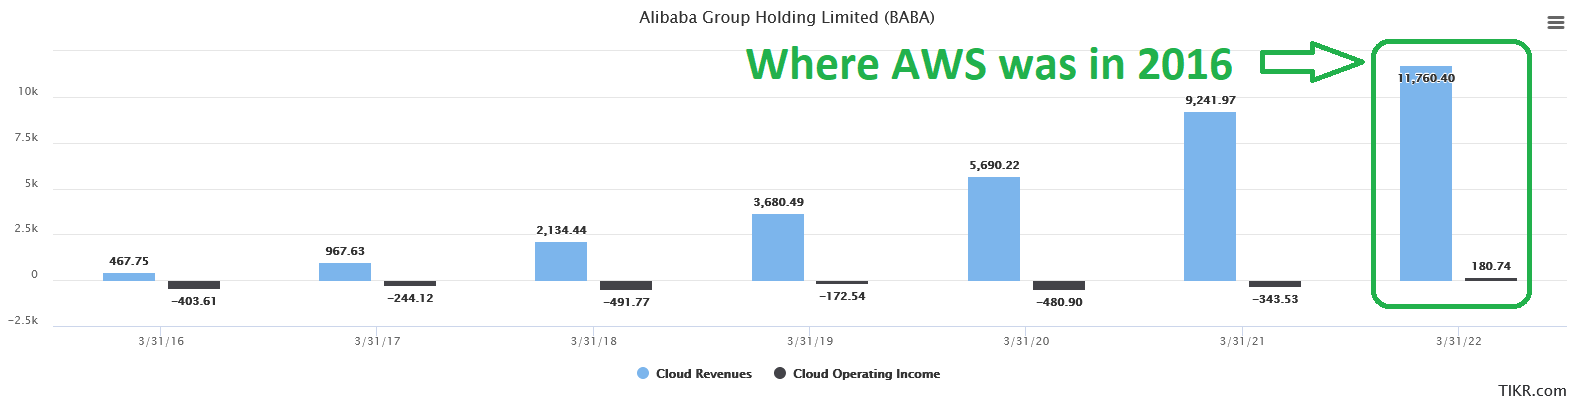
AliCloud Now: 11.8B Rev. 180M Operating Income.
Amazon AWS 2016: $12.2B Rev. 3.1B Operating Income.
Amazon AWS 2021: $62.2B Rev. 18.5B Operating Income (29% operating margin).
- McKinsey expects China’s public cloud market to triple in size in the next few years, from US$32 billion in 2021 to US$90 billion by 2025 (SCMP Article Here)
- BABA – 36.7% share of China’s public cloud IaaS (Infrastructure as a service) and PaaS (Platform as a service)
- Amazon comp: 29% operating margin on AWS business.
- $90B public cloud x 36.7% share = 33.3B x 29% operating margin (at scale) = ~$10B of NEW OPERATING INCOME FOR ALIBABA.
- This compares to its total current operating income of 15.2B or peak operating income of 16.7B. In other words if the other businesses stopped growing, the operating income would be 60% greater than when the shares traded at $319 on US ADS. At a peak multiple that implies a ~$500 stock assuming no growth in China or International Commerce. Cut it in half and you’re still over $250 by 2025.
- They still have $71B cash to reduce share count on top of it.
- 1/3 ownership of Ant financial ($300B IPO Valuation, $150B today due to sentiment)
- Revenues grew ~800%, Earnings ~500% since IPO (buy for 2014 prices)
ZeroCovid winding down post China National Congress. Already seeing recovery in Macau Gaming Stocks. China stimulating aggressively while rest of world tightens. Unleashed post CNC.
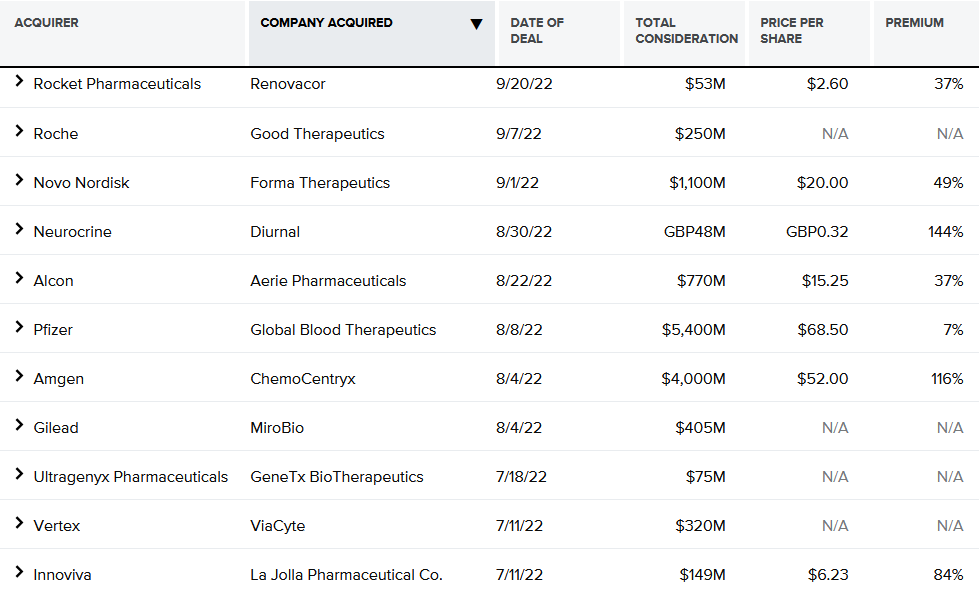
- Biotech (XBI): 2 catalysts – Deals and Drugs. Both Happening Now. Group bottomed in May.
Catalysts playing out:
- Major Drug Progress/trial results (Lecanemab) Biogen.
LECANEMAB CONFIRMATORY PHASE 3 CLARITY AD STUDY MET PRIMARY ENDPOINT, SHOWING HIGHLY STATISTICALLY SIGNIFICANT REDUCTION OF CLINICAL DECLINE IN LARGE GLOBAL CLINICAL STUDY OF 1,795 PARTICIPANTS WITH EARLY ALZHEIMER’S DISEASE
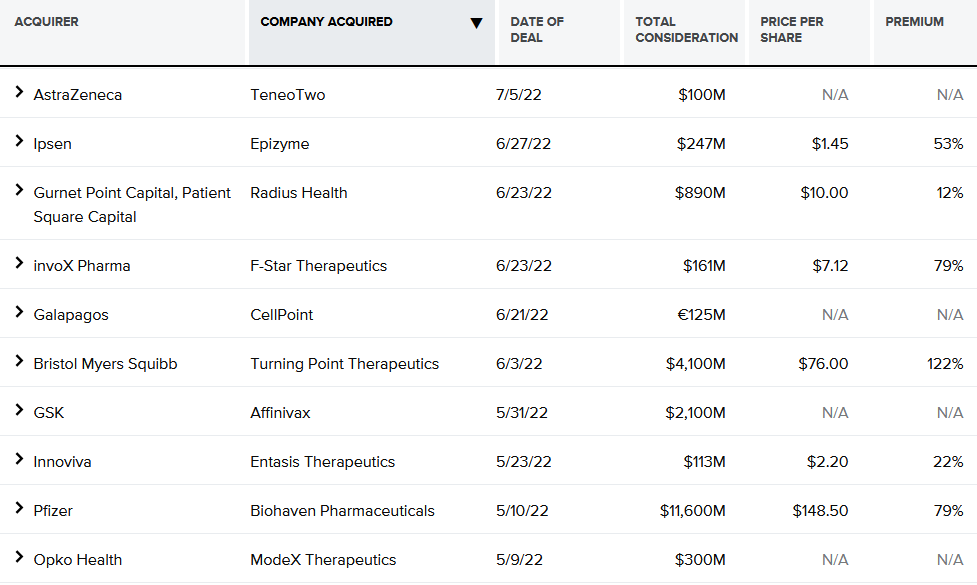
- Major Deal Activity since May
(Click on image to enlarge)
(Click on image to enlarge)
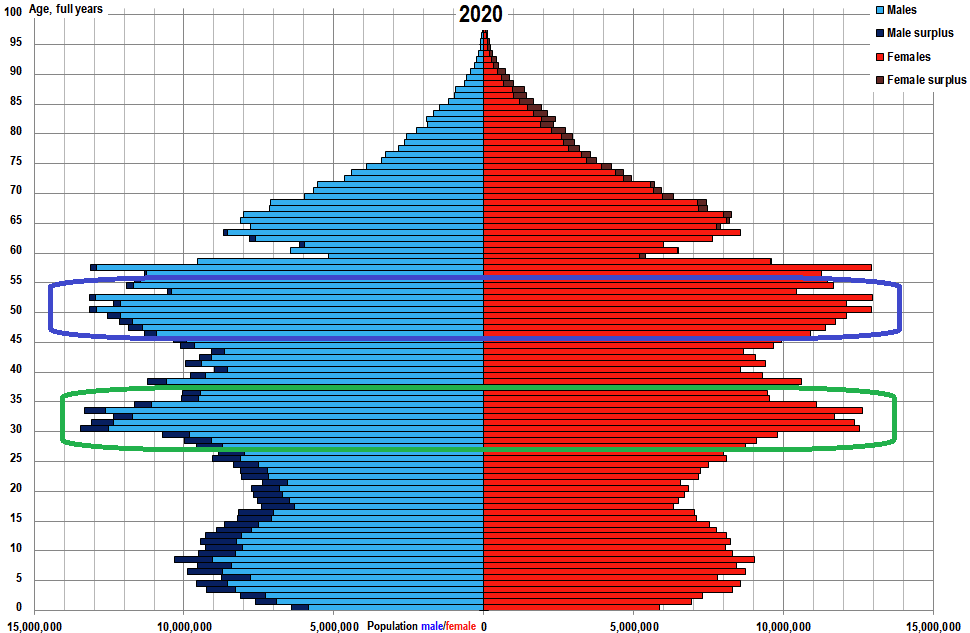
I went into more granular detail with Marcel Munch on his podcast “East West Investment Opportunities.” Thanks to Marcel for having me on. In this segment we discuss China demographics, history, policy and sum of the parts analysis on Alibaba.
China Demographic Data I referenced in segment:
(Click on image to enlarge)
US Outlook Here:
Thanks to Taylor Clothier, Sydnee Fried, Seana Smith, Dave Briggs and Rachelle Akuffo for having me on Yahoo Finance (in studio) on Thursday to discuss US Stock Market and Outlook.
Now onto the shorter term view for the General Market:
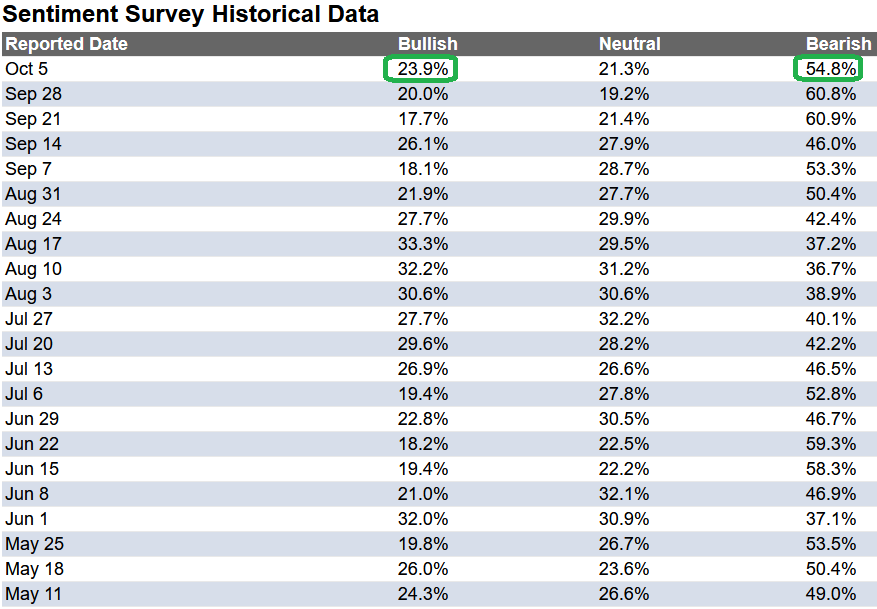
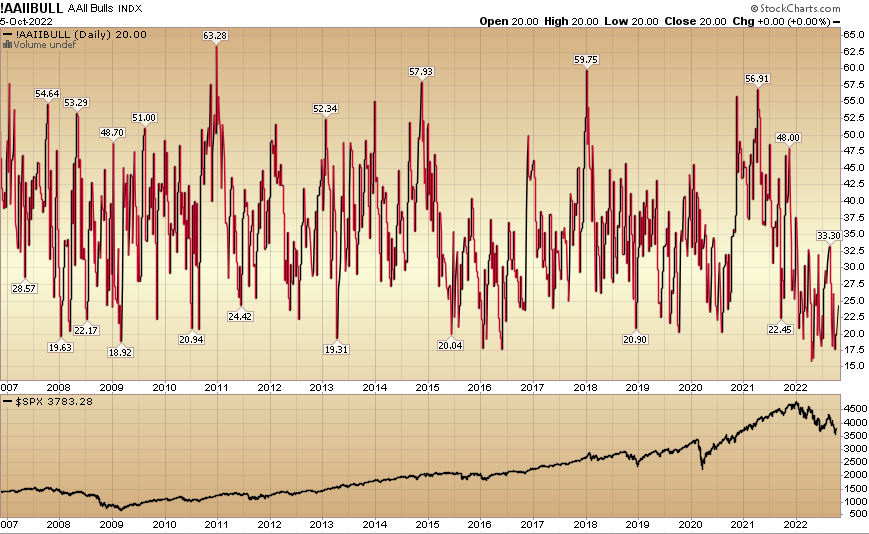
In this last week’s AAII Sentiment Survey result, Bullish Percent (Video Explanation) ticked up to 23.9% from 20.0% the previous week. Bearish Percent ticked down to 54.8% from 60.8%. Retail Sentiment is ticking up from lower levels than it was at the pandemic lows (20.23) and near the Great Financial Crisis lows of (18.92).
(Click on image to enlarge)
(Click on image to enlarge)
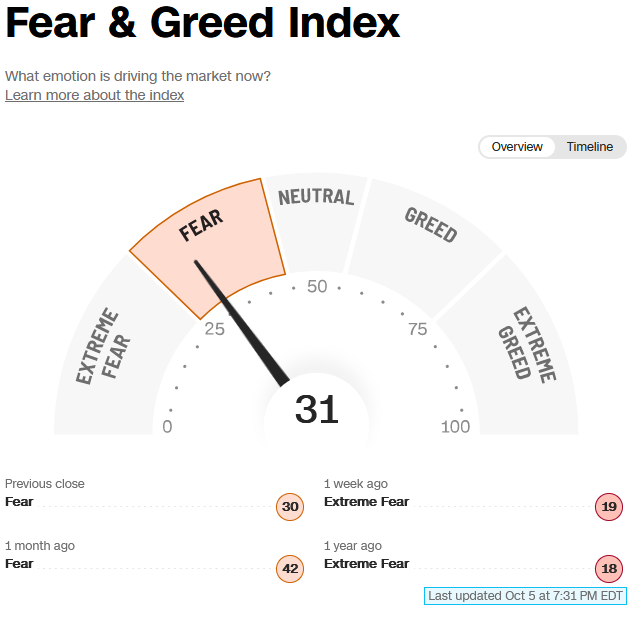
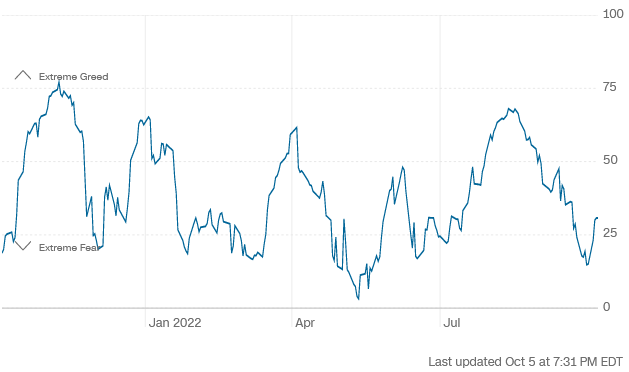
The CNN “Fear and Greed” moved up from 19 last week to 31 this week. Sentiment is still fearful. You can learn how this indicator is calculated and how it works here: (Video Explanation)
(Click on image to enlarge)
(Click on image to enlarge)
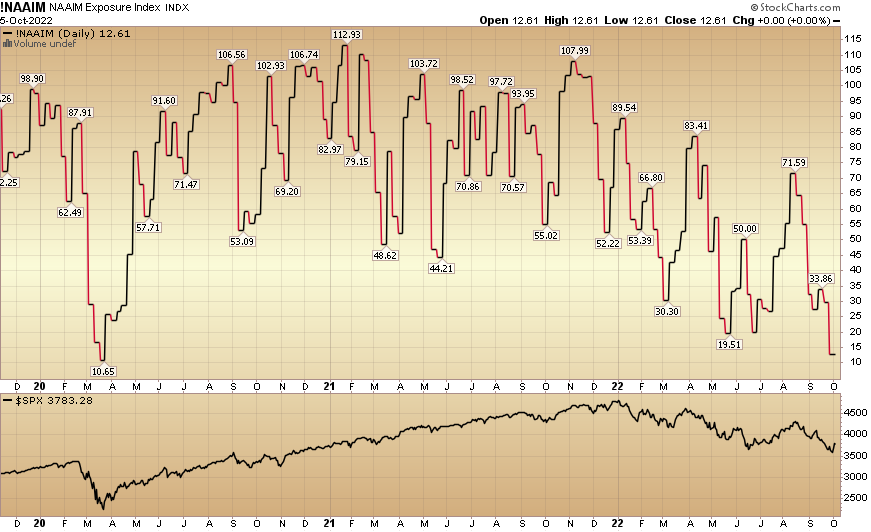
And finally, the NAAIM (National Association of Active Investment Managers Index) (Video Explanation) dropped to 12.61% this week from 29.59% equity exposure last week. Any further good news and managers will be forced to chase up into year-end:
(Click on image to enlarge)
Our podcast|videocast will be out on Friday this week. Each week, we have a segment called “Ask Me Anything (AMA)” where we answer questions sent in by our audience. If you have a question for this week’s episode, please send it in at the contact form here.
More By This Author:
3 Down, 1 To Go Stock Market (And Sentiment Results)
“The Final Countdown” Stock Market (and Sentiment Results)…
3 Investing Themes For The Next 3 Years


Comments
Log in or sign up to join the conversation.