
Disney Update
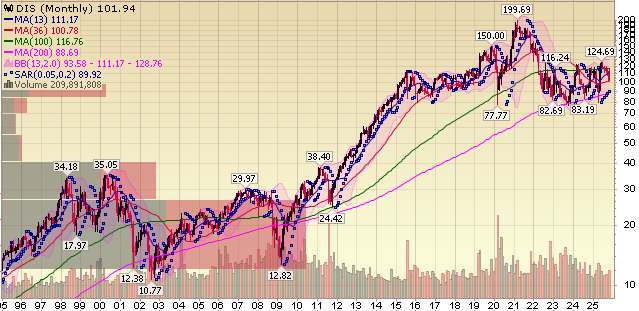
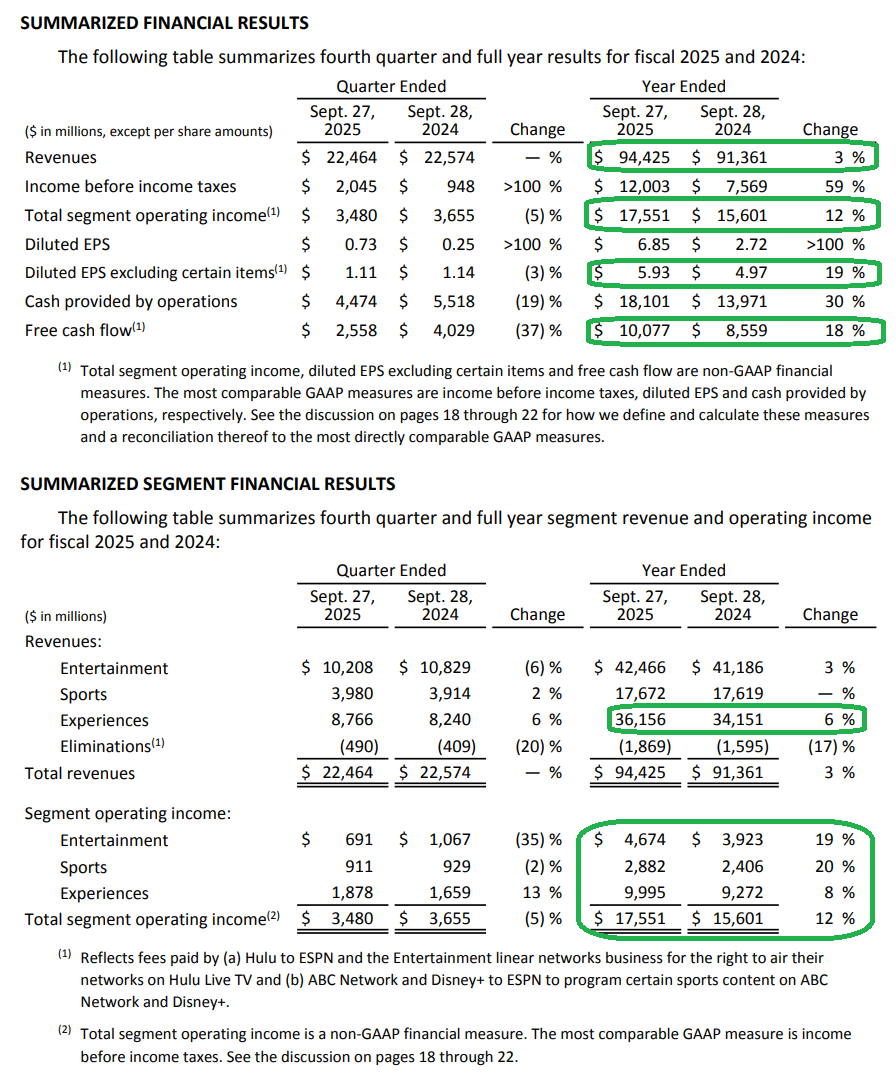
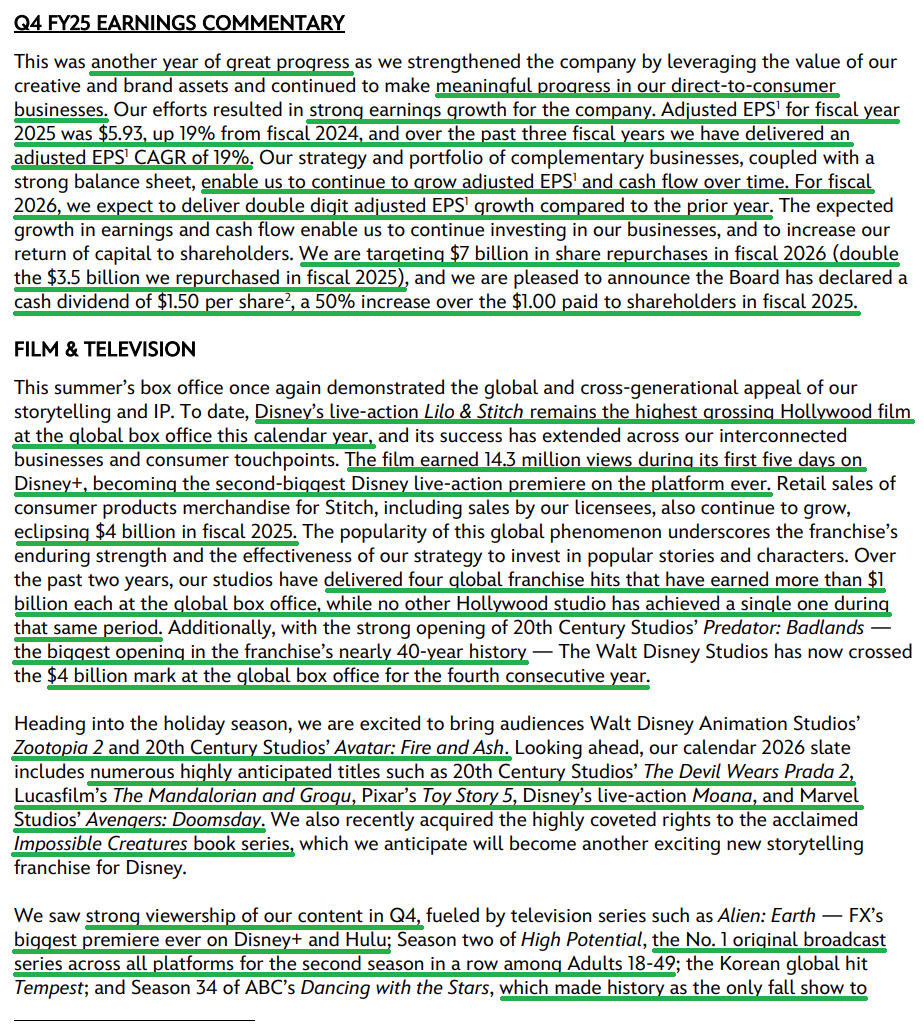
Disney (DIS) posted another solid quarter earlier this month and closed out what was by all measures a very strong FY2025. Revenue rose 3% to $94.4 billion for the full year. Adjusted EPS increased 19% to $5.93, marking a 19% CAGR over the past three fiscal years. Free cash flow reached ~$10 billion, finally surpassing the pre-covid watermark and setting new all time highs after six years. Even more importantly, guidance points to continued strength in the year ahead, exactly the signs we want to see in any turnaround.
Rather than focusing on the fundamentals that actually move the needle, the market chose to fixate on a few short term one-off headwinds, from cruise pre-opening expenses to theatrical timing that created tough comps. Of course, that kind of quarterly choppiness has zero bearing on our long term thesis or the strength of the turnaround, which is why we view the market’s reaction as complete silly season.
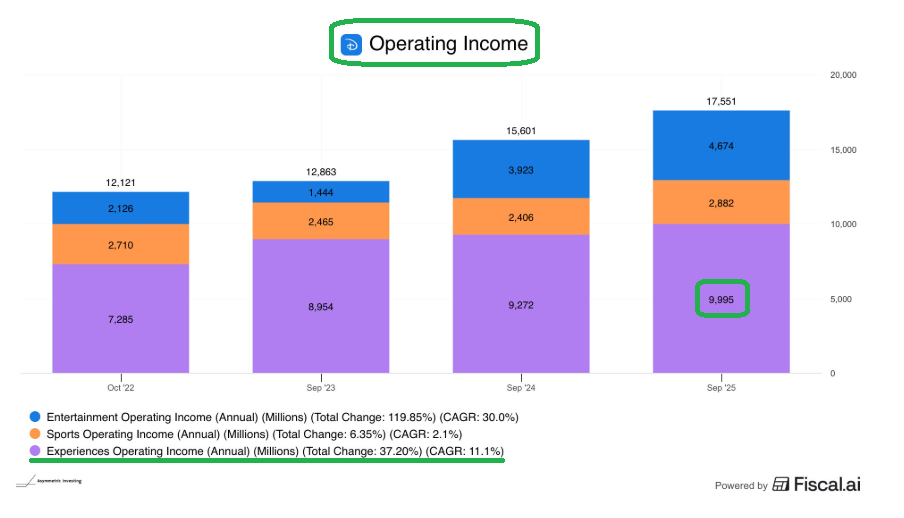
That brings us back to why we own the name in the first place. When we originally built our position, we essentially underwrote Disney at a level where we were paying for the Experiences segment alone. Parks, cruises, and consumer products together generated close to $10 billion of operating income and we believed were worth close to $80 per share on a stand-alone basis. That meant the rest of the business, whether ESPN, DTC, the studio assets, or the linear networks, was essentially being thrown in as a free flier.
(Click on image to enlarge)
At the time, Mr. Market had assigned these segments close to zero value simply because Disney hit a few bumps and took its eye off the ball. But with a 100+ year operating history and a long record of navigating cycles, we were more than willing to take the other side. With a margin of safety that large and a business this durable, it didn’t take rocket science to see the value.
We expected that once Iger returned, he would right the ship and get these segments back on track so Disney could get back to doing what it does best. In the meantime, the Experiences segment would buy the company time to work through the hiccups, build out its next growth engine in DTC, and squeeze the remaining juice out of the linear networks.
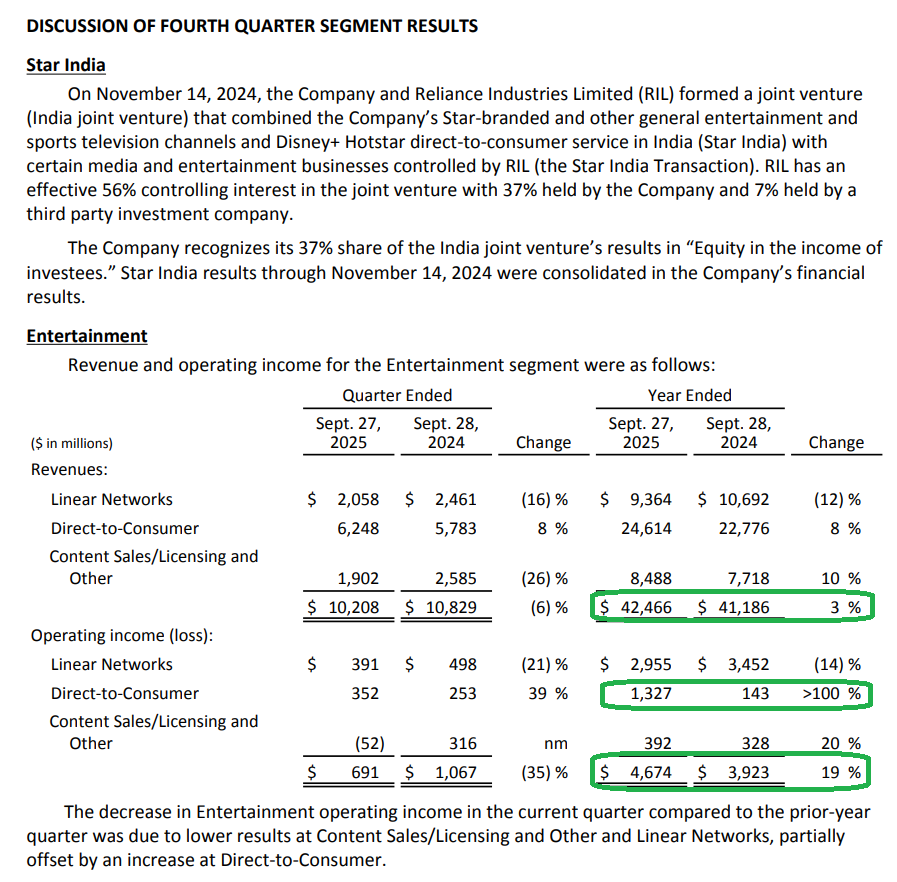
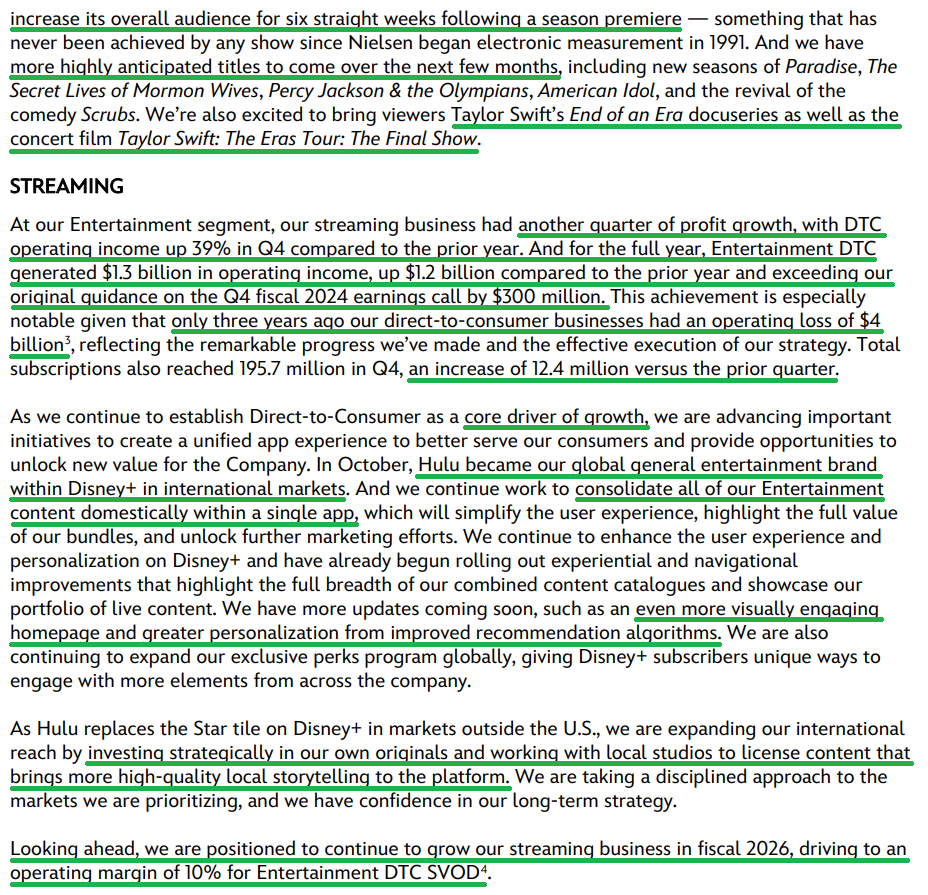
Fast forward to today, and our original thesis remains firmly intact. The only difference is that those same businesses once written off as having zero value have come roaring back and are stronger than ever. DTC just posted $1.3 billion of operating income and is on track for 10% operating margins in FY2026 after posting a $4 billion loss only three years ago.
The film slate is the strongest it has been in years, with the studio delivering four $1+ billion releases over the past two years while no other studio delivered a single one.
Again, none of this required a stroke of genius. It simply required knowing what we owned, understanding the cycles, and recognizing that sentiment swings to extremes and eventually reverts to the mean.
So it should be no surprise that our confidence continues to grow, with or without Mr. Market’s manic reaction in the short term. We continue to see Disney as one of the most durable businesses with some of the strongest IP on the planet. As a double-digit earnings compounder that lets us sleep like a baby at night, Disney remains a no brainer, and sooner or later the market will come around to that reality.
Q4 Earnings Breakdown


10 Key Points
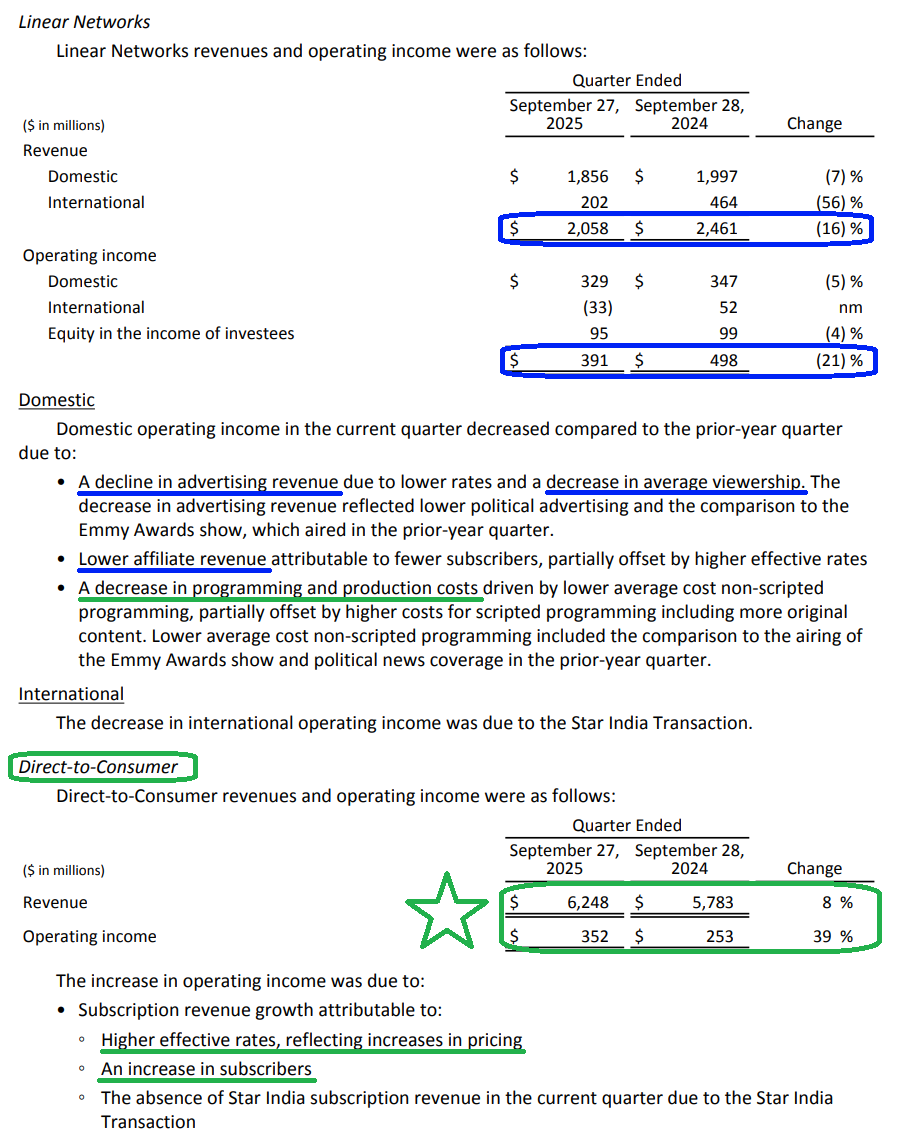
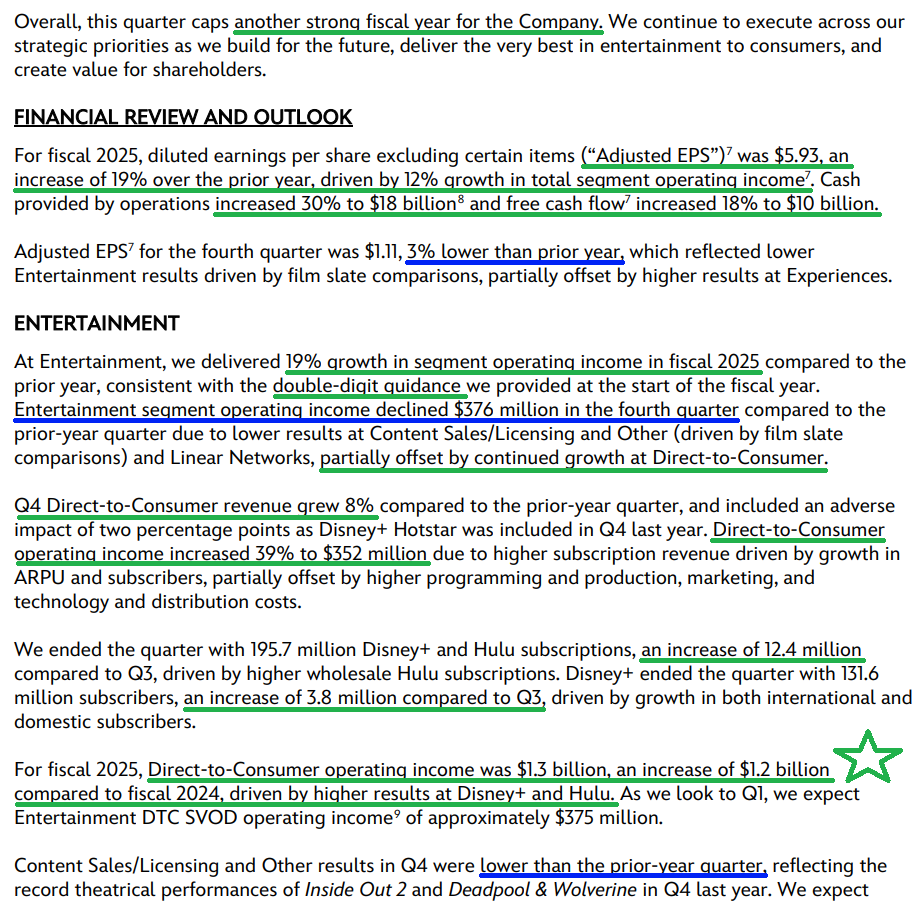
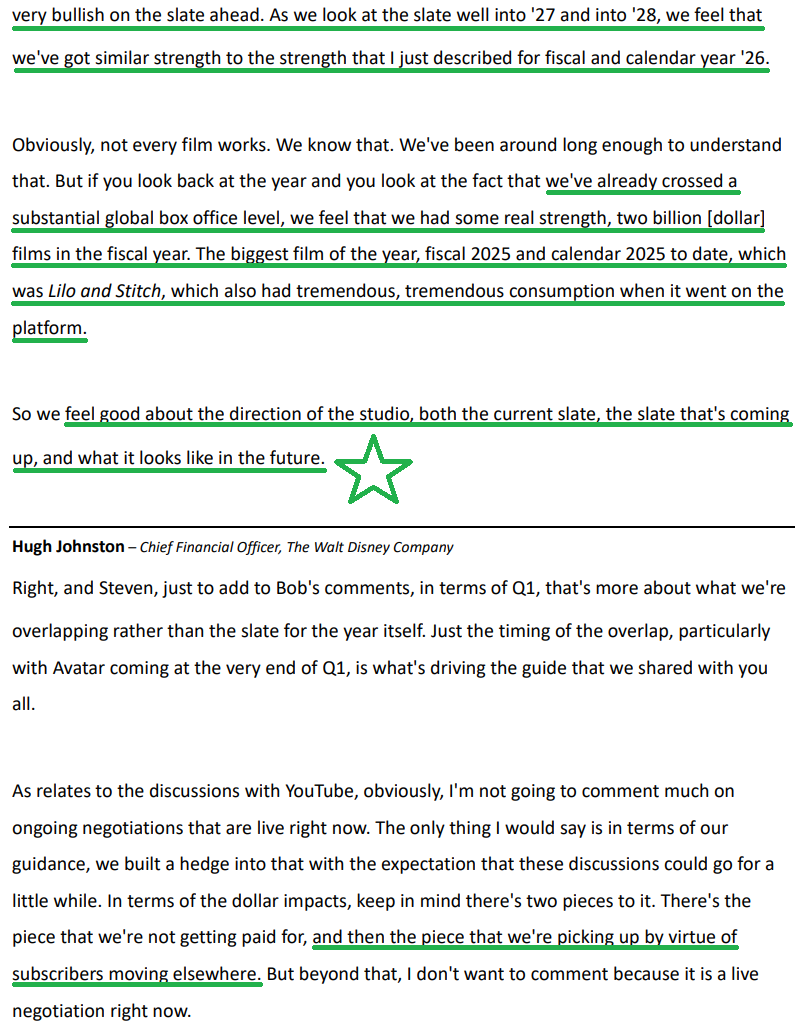
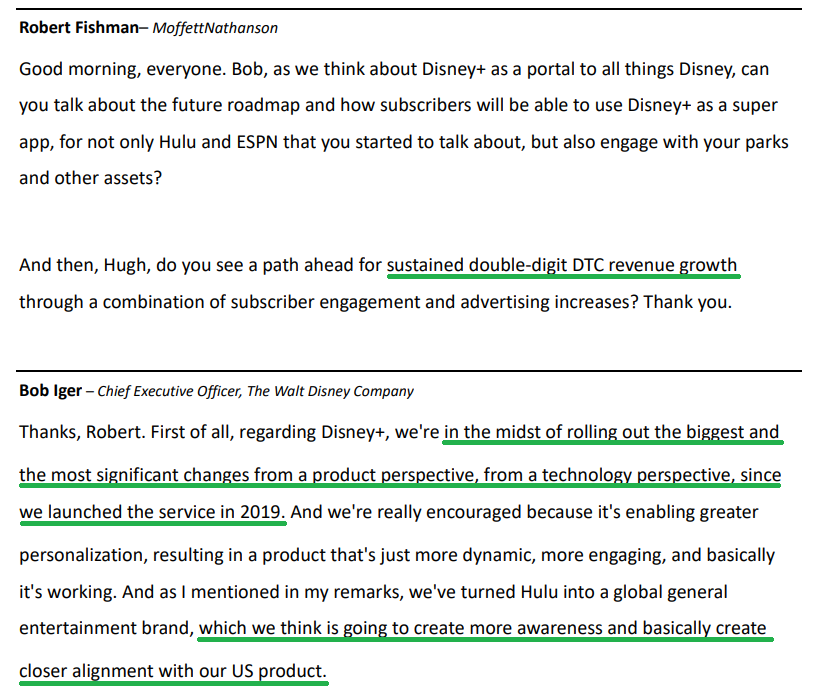
1) DTC posted another strong quarter, with revenue up 8% to $6.25 billion and operating income up 39% to $352 million (~5.6% EBIT margins). That brings full year operating income to $1.3 billion, compared with $143 million last year and initial guidance of ~$1 billion. Management expects DTC to reach 10% operating margins for the full year and sees sustained double-digit top line growth ahead as the segment takes the baton as Disney’s next growth engine, with significant room for further margin expansion still to come.
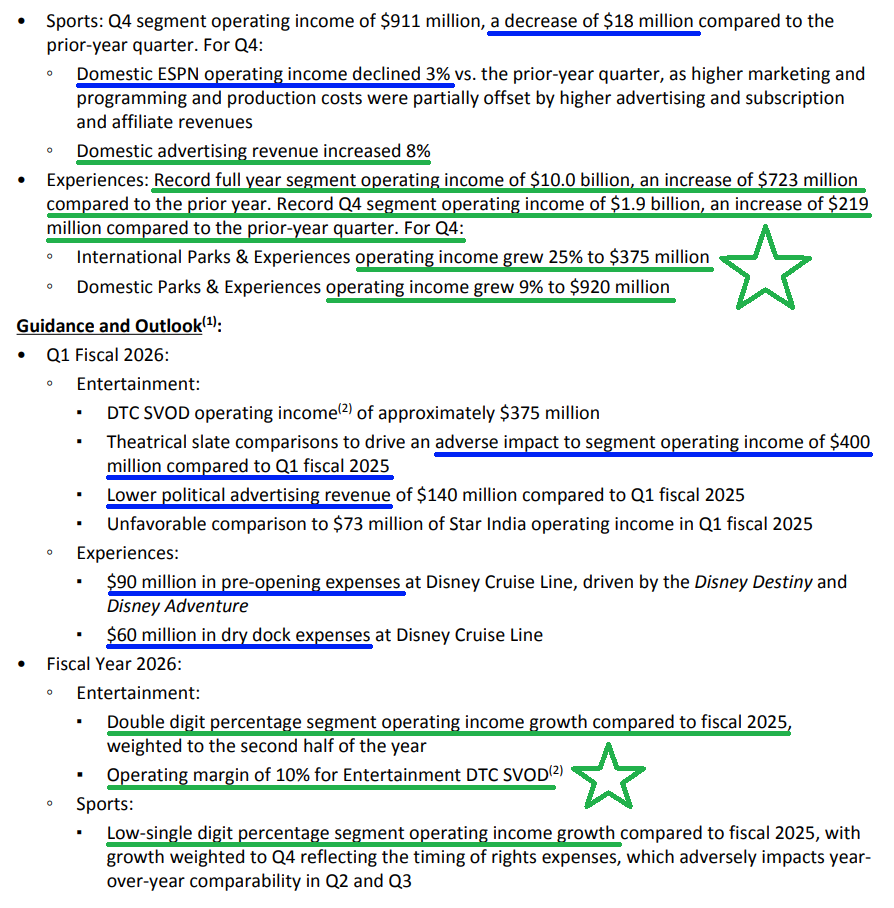
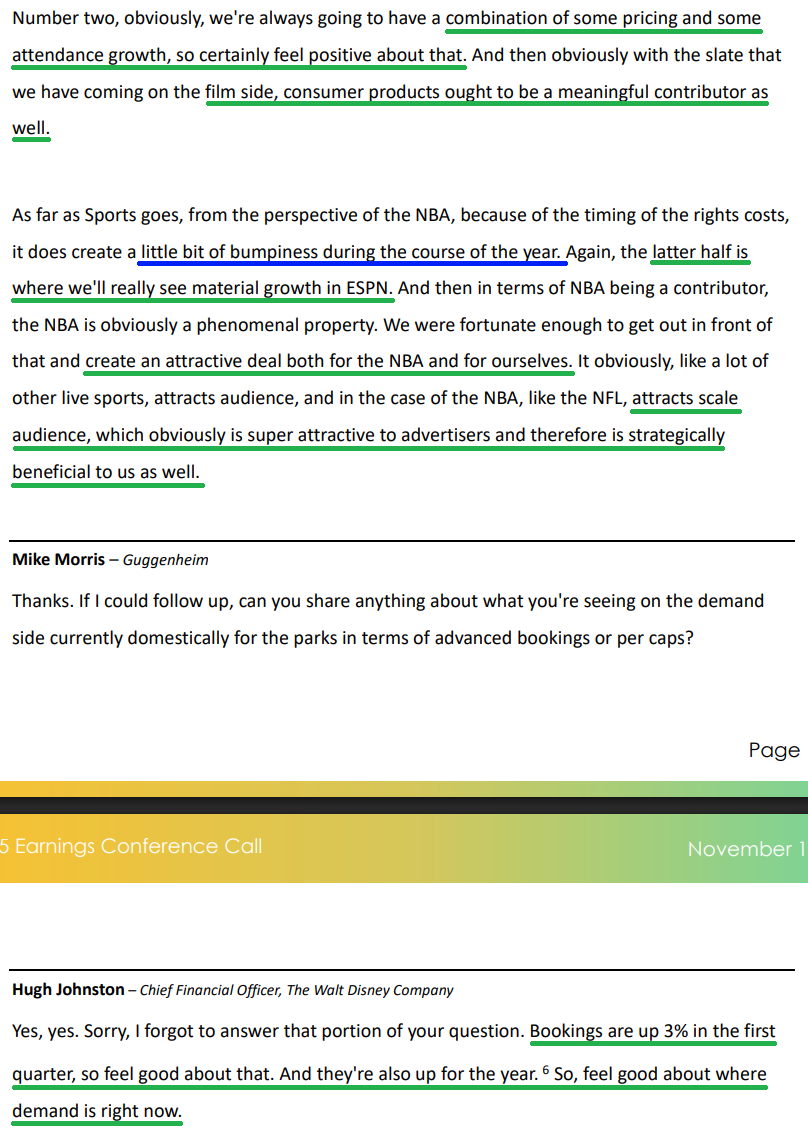
2) The Experiences segment, Disney’s bread-and-butter business, posted 6% growth in Q4 to $8.77 billion and delivered record Q4 operating income of $1.9 billion, up 13% YoY. For the full year, the segment generated $36.16 billion in revenue (+6%) and a record ~$10 billion in operating income (+8%), accounting for just under 60% of the company’s total operating income. Management expects another strong year ahead for Experiences, guiding to high single-digit operating income growth, with domestic bookings already up 3% in the first quarter and up for the full year, showing no signs of a weakening consumer.
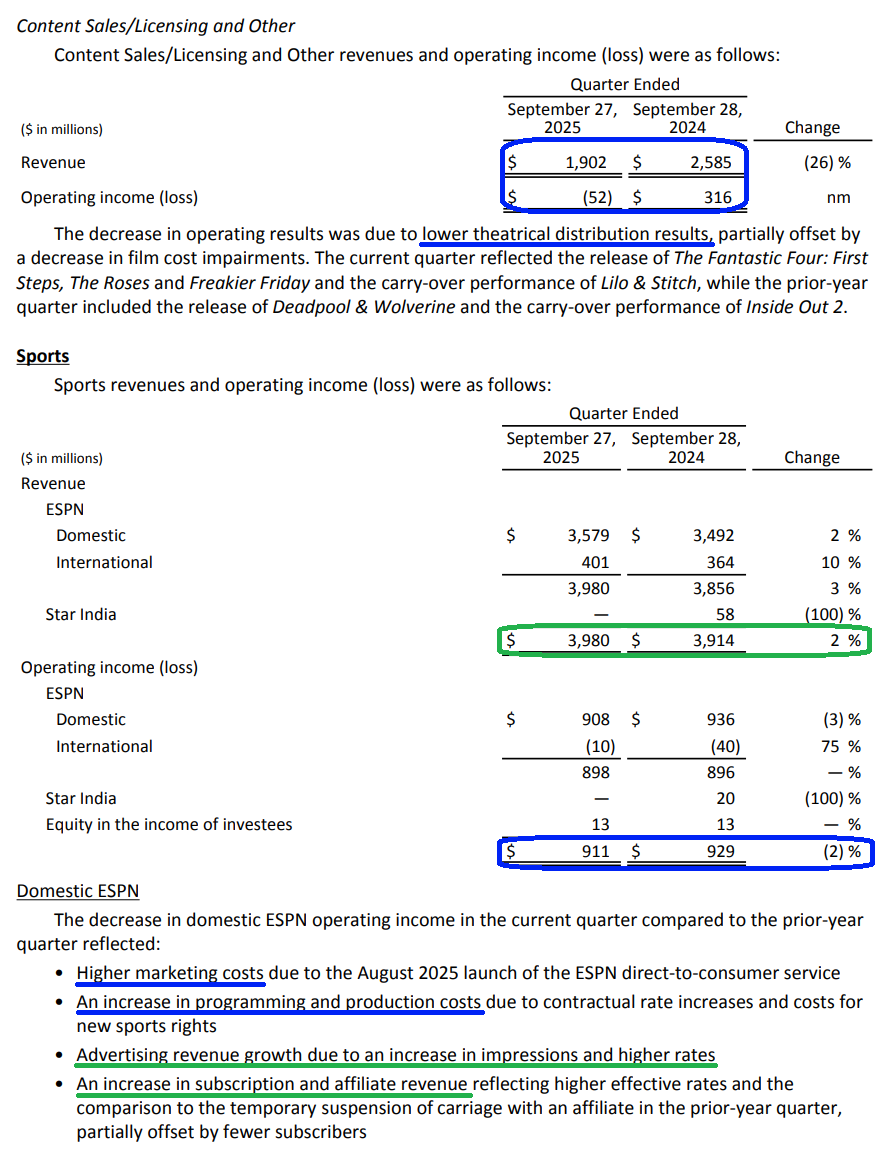
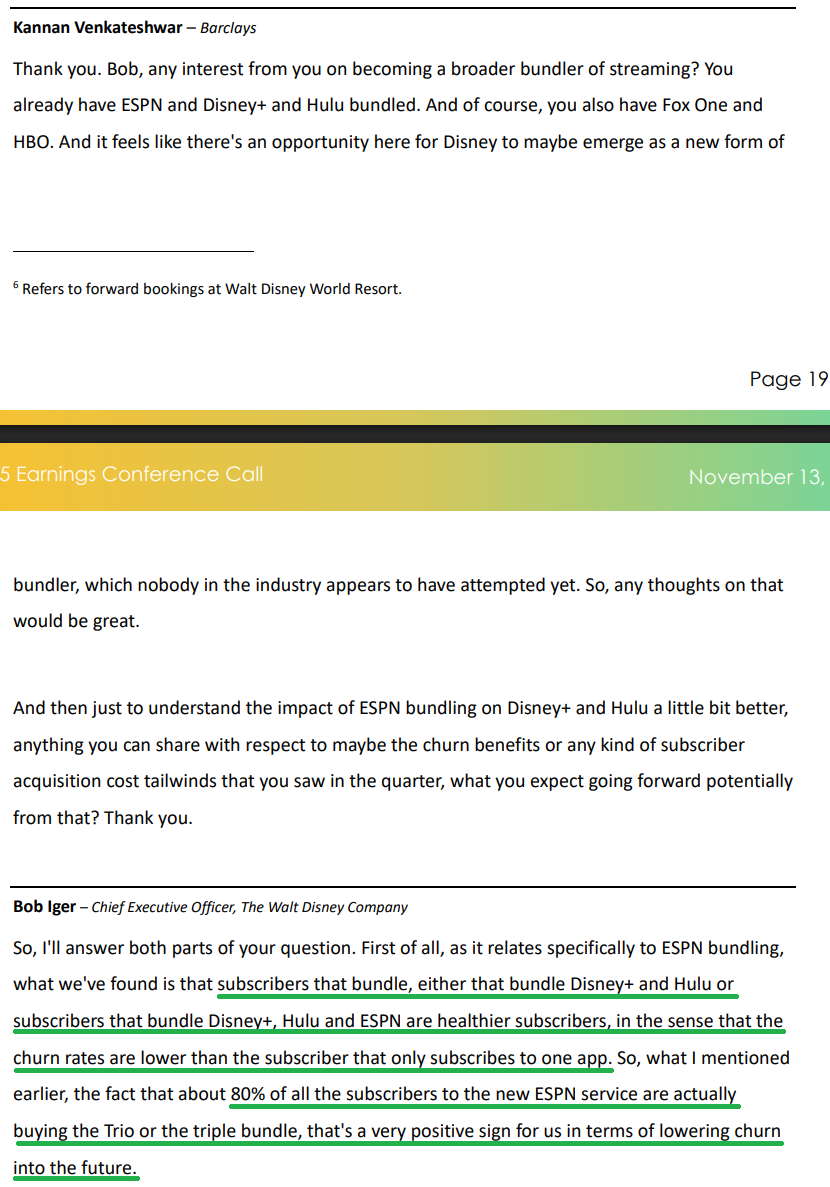
3) The Sports segment posted $17.67 billion in revenue for the full year, flat YoY, while operating income grew 20% to $2.88 billion, coming in 7 ppts ahead of prior guidance. The new ESPN full DTC service and enhanced ESPN app are off to a strong start, with ~80% of ESPN subscribers opting for the trio bundle that includes Disney+ and Hulu, a very positive sign for meaningfully reduced churn.
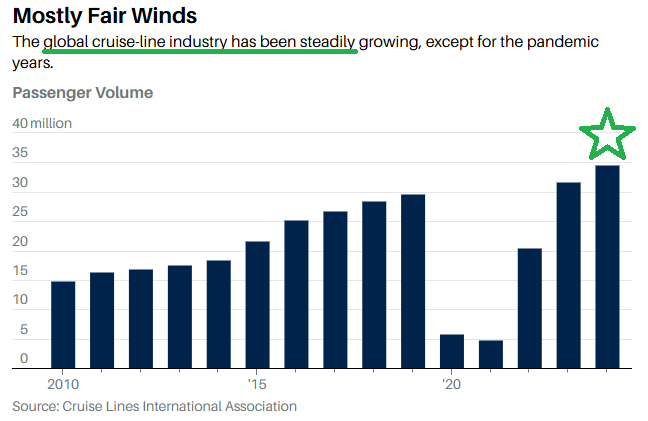
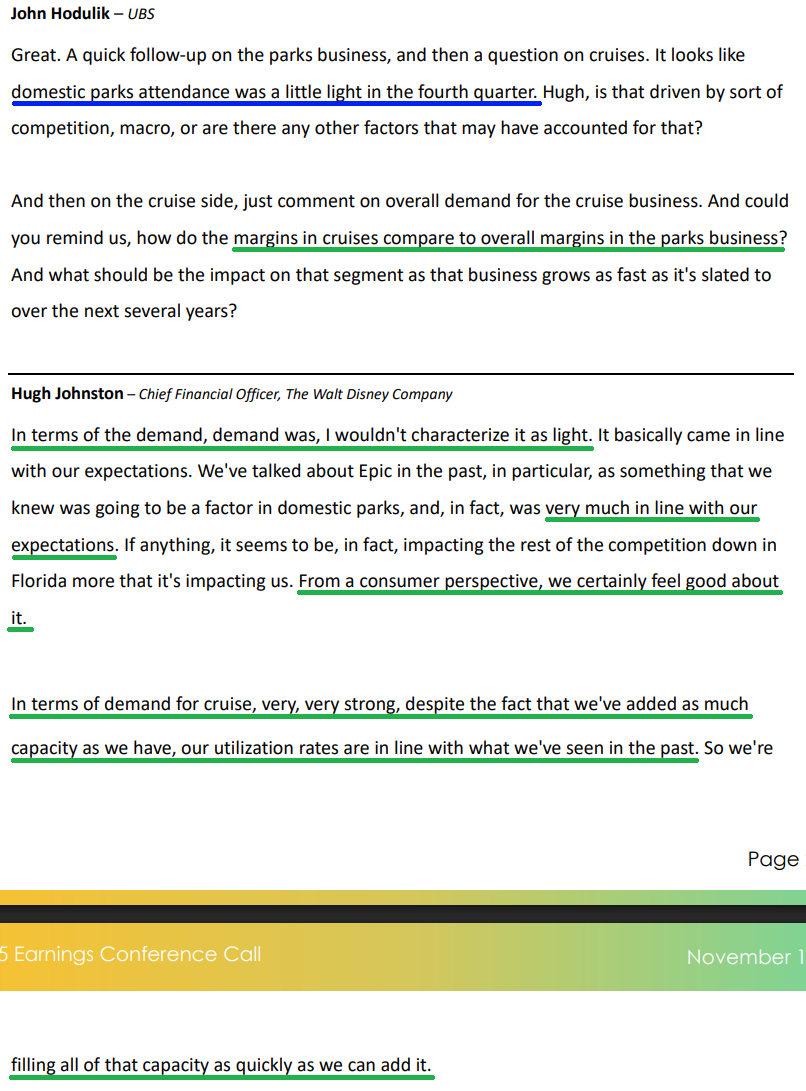
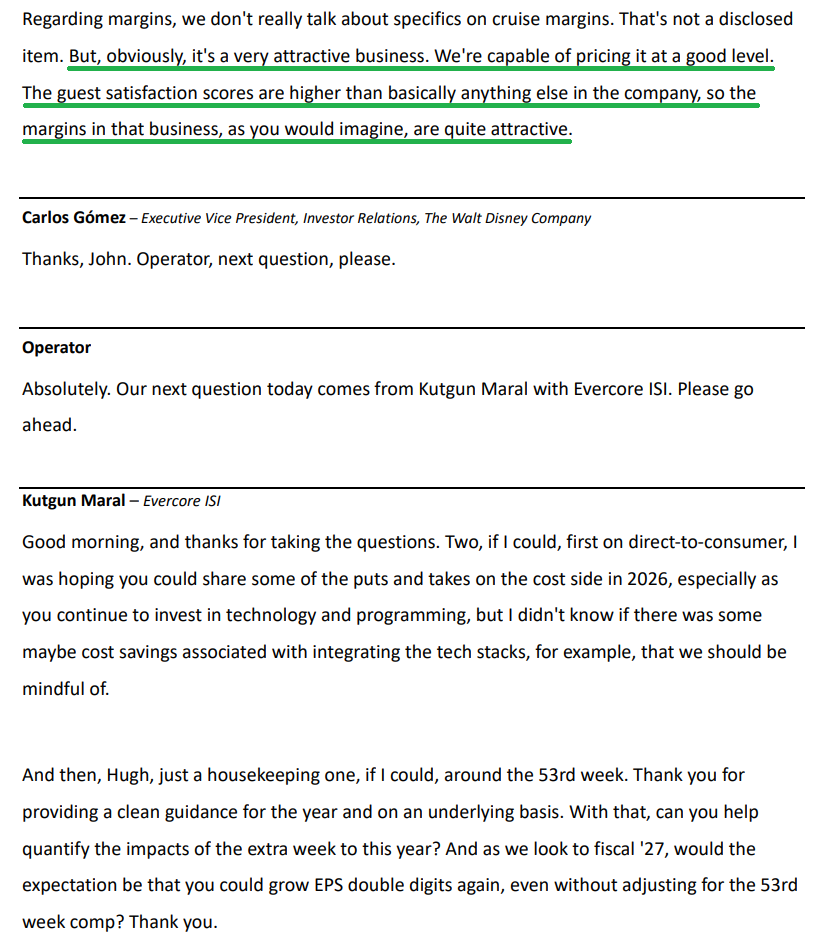
4) Disney’s big bet on Cruises continues to pay off, with demand remaining very strong and new capacity filling as quickly as they can bring it online. Utilization has held in line with historical levels despite an ~60% increase in capacity. Disney has two new ships launching in the coming months, bringing the fleet to 8 ships, with 5 additional ships scheduled beyond FY2026 that are expected to be meaningful contributors to Experiences growth in the years ahead. While management doesn’t break out Cruises separately, they continue to highlight the segment’s highly attractive margins and the highest guest satisfaction ratings across the entire company, which provides significant pricing power.
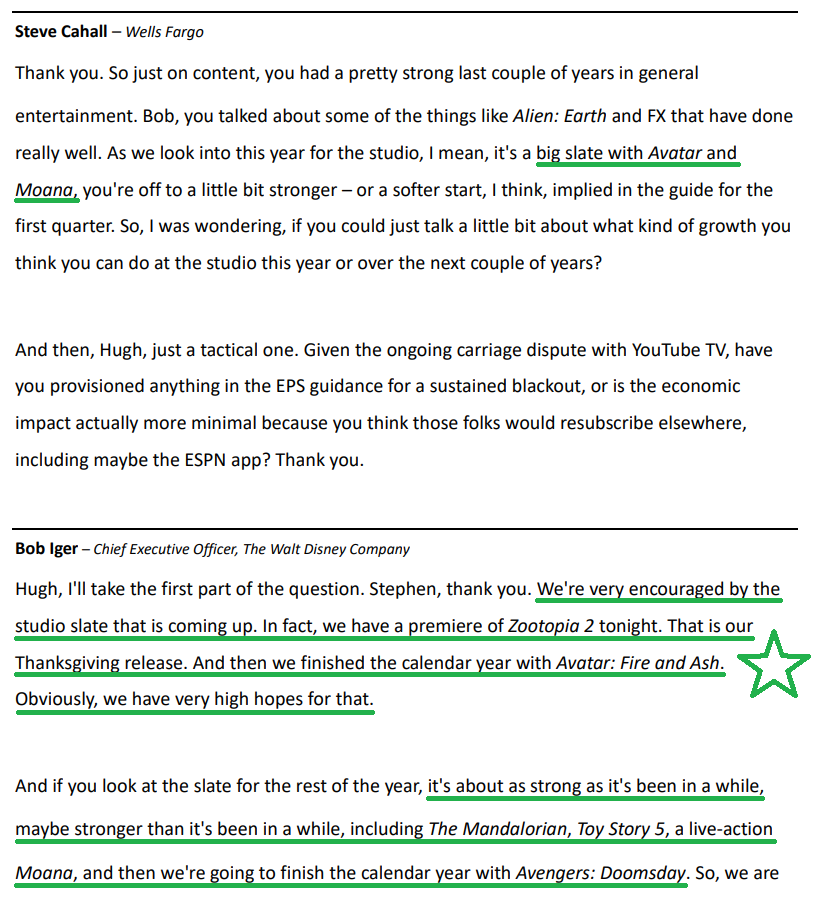
5) Management sees the upcoming slate as the strongest in years, led by Zootopia 2 and Avatar: Fire and Ash in 2025 and followed by The Mandalorian and Grogu, Toy Story 5, the live-action Moana, and Avengers: Doomsday in 2026. Disney has already cleared $4 billion at the global box office for the fourth consecutive year and has produced four $1+ billion films over the past two years, while no other studio has delivered a single one.
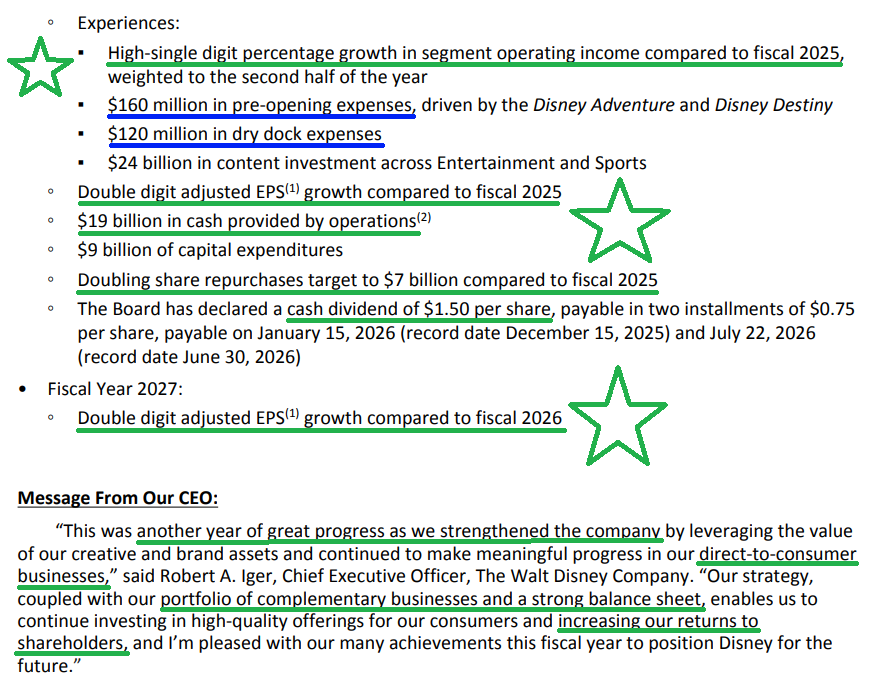
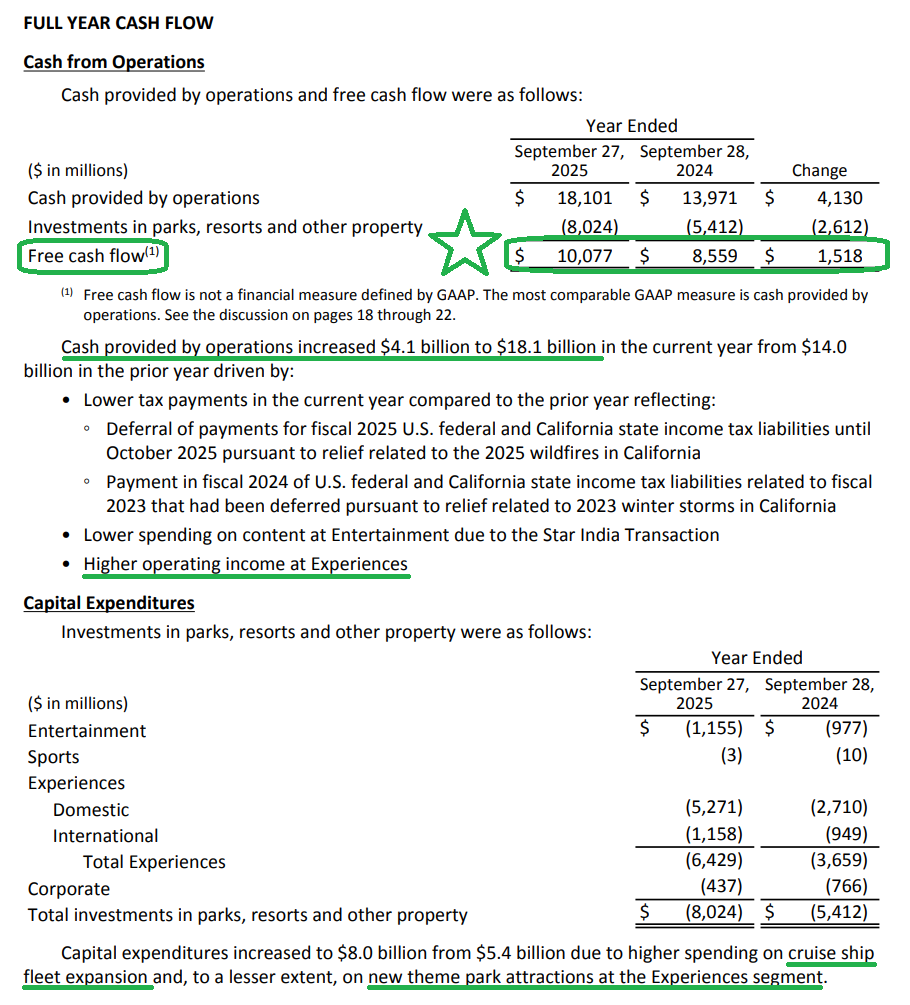
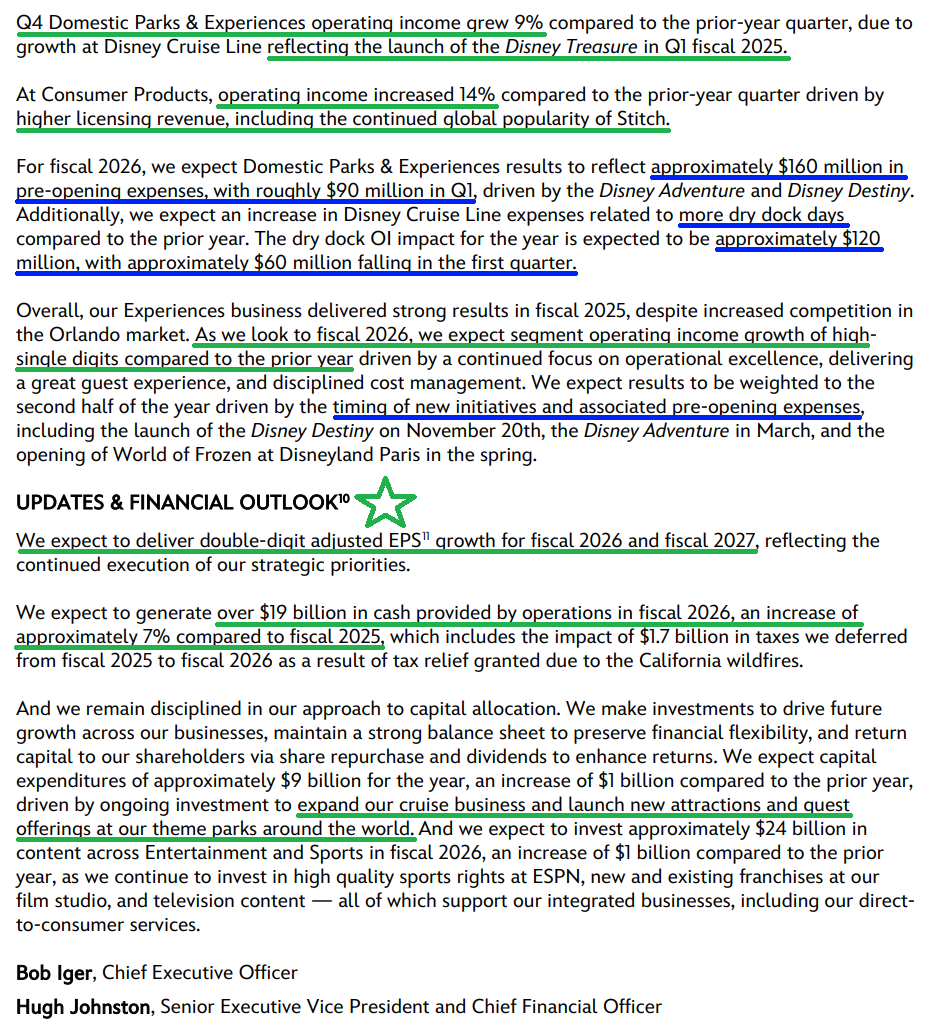
6) Disney generated $18.1 billion in operating cash flow for the full year, with free cash flow reaching $10.77 billion, up 18% YoY and a record high. For FY2026, management expects operating cash flow of $19 billion, which includes a $1.7 billion tax impact that had been previously deferred. Backing that out, operating cash flow would grow 28% YoY. Management remains confident in strong free cash flow going forward as investment levels begin to taper.
7) Subscriber growth came in better than expected, with total Disney+ and Hulu subscriptions reaching 196 million, an increase of 12.4 million sequentially driven mainly by higher wholesale Hulu subscriptions. Disney+ added 3.8 million subscribers organically, up 3% sequentially, with average revenue per user up 2% to $8.04.
8) Management is doubling planned share repurchases for FY2026, bringing total buybacks to $7 billion, and is also increasing the cash dividend to $1.50 per share, up 50% YoY with a 1.5% yield.
9) Disney continues to invest heavily in the Experiences segment, with expansion projects underway at every theme park, five additional cruise ships scheduled for launch beyond FY2026, and a new theme park planned for Abu Dhabi. Full year capex for 2025 came in at $8 billion, up from $5.4 billion in the prior year, and is expected to rise to $9 billion in FY2026. Most importantly, returns on invested capital for the segment remain highly attractive and reached record highs earlier this year.
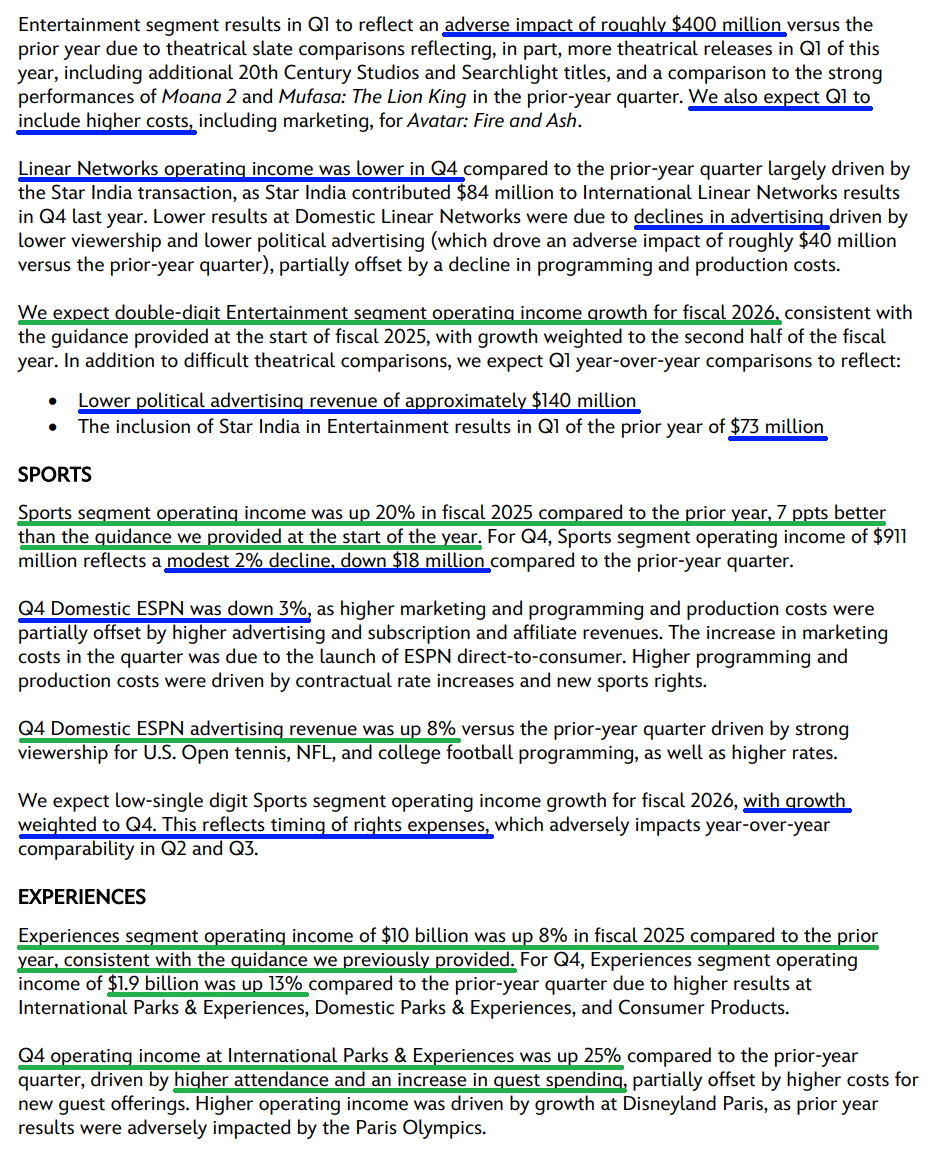
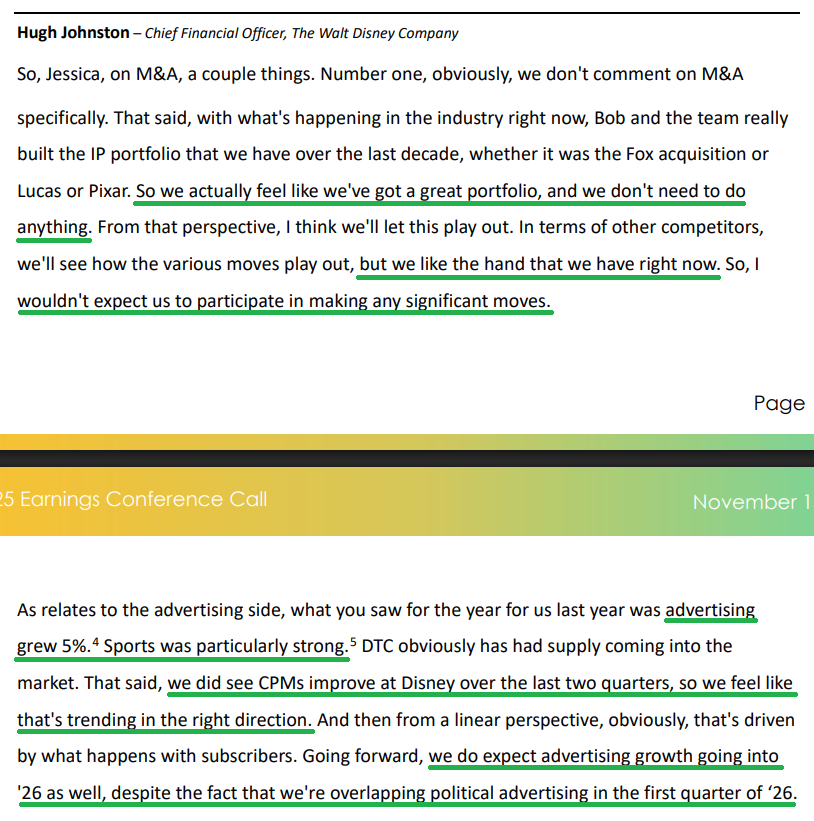
10) Management’s Q1 guidance came in weaker than expected due to a handful of one-time expenses, including $90 million in pre-opening costs for Cruises, $60 million in dry dock expenses, theatrical slate timing, and lower political advertising revenue. For the full year, management still expects to deliver double digit adjusted EPS and reiterated confidence in double digit EPS growth for FY2027.
Earnings Call Highlights


Morningstar Analyst Note

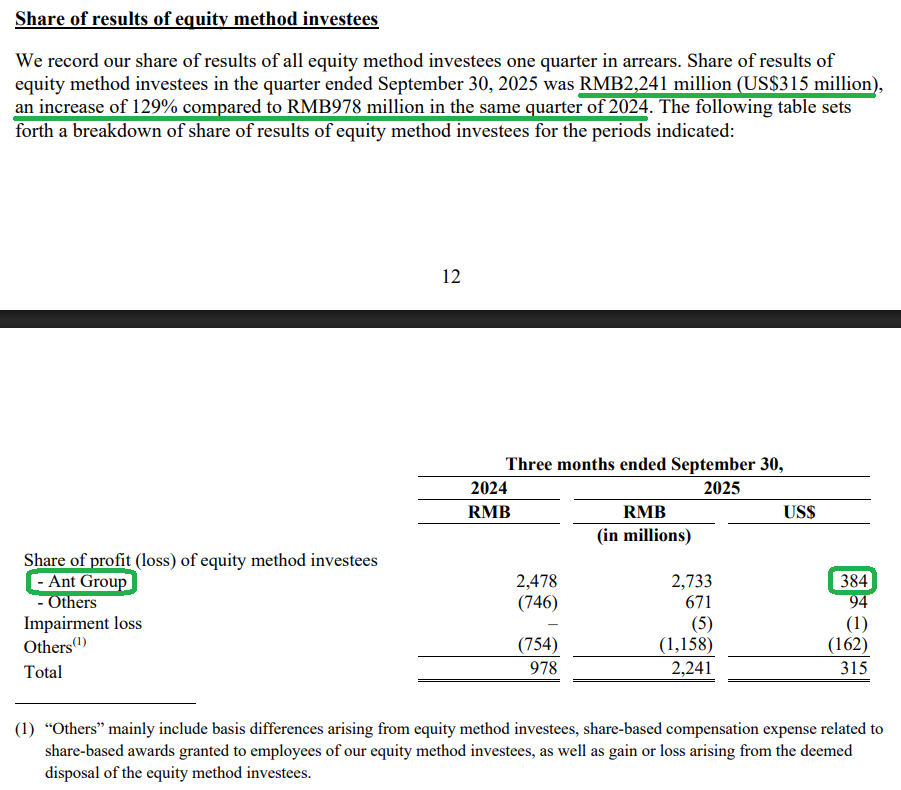
Alibaba (BABA) Update
Q2 Earnings Breakdown
(Click on image to enlarge)


10 Key Points
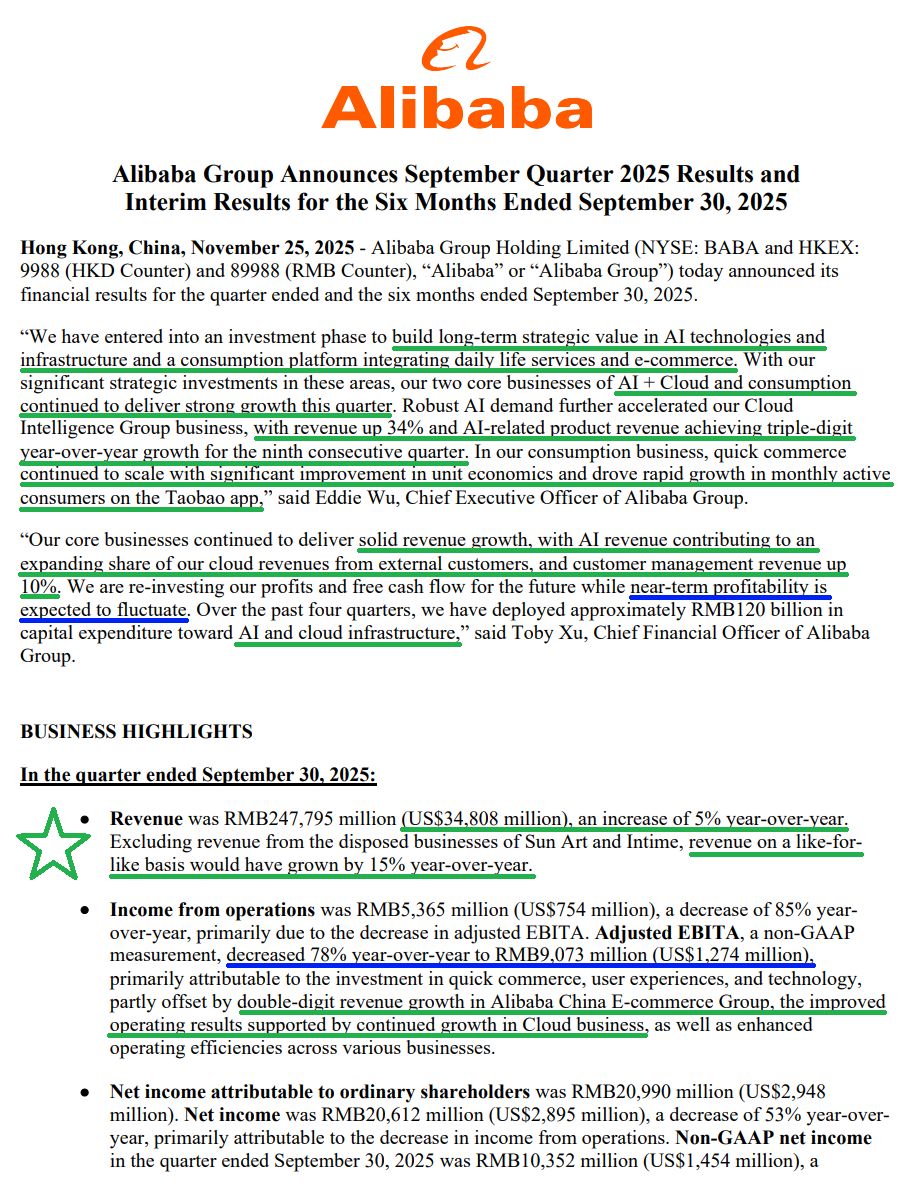
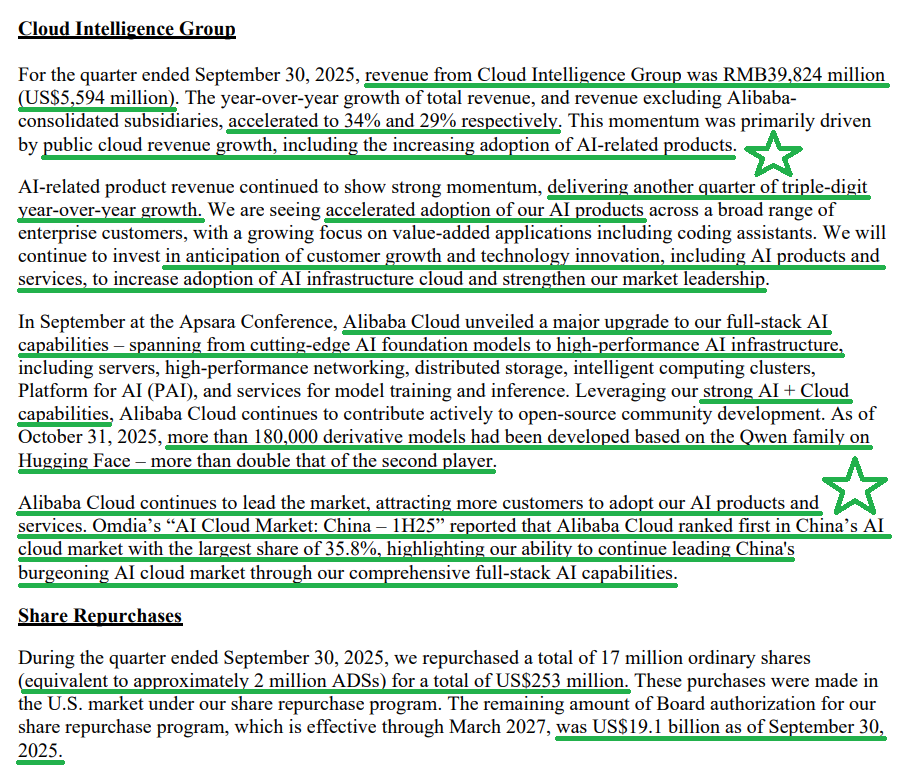
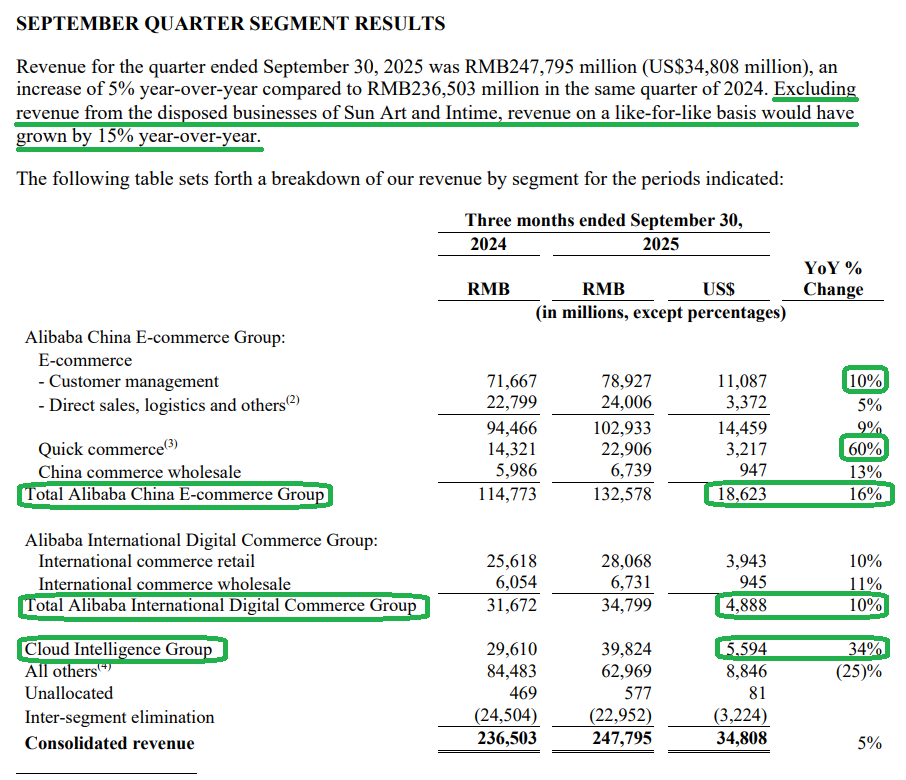
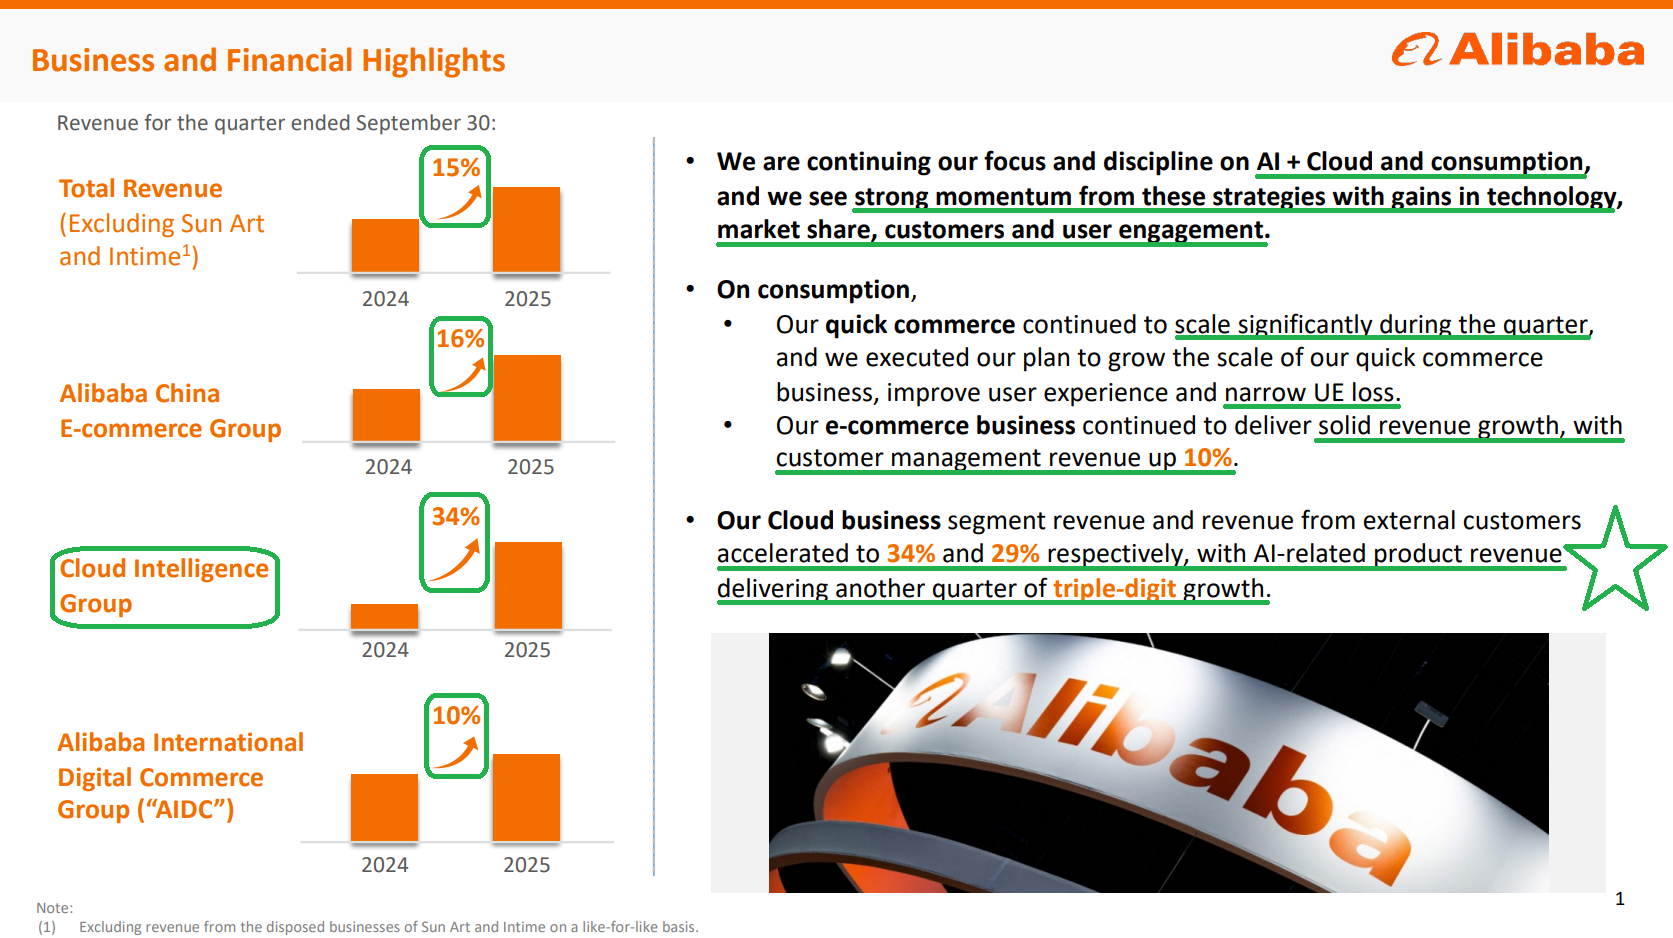
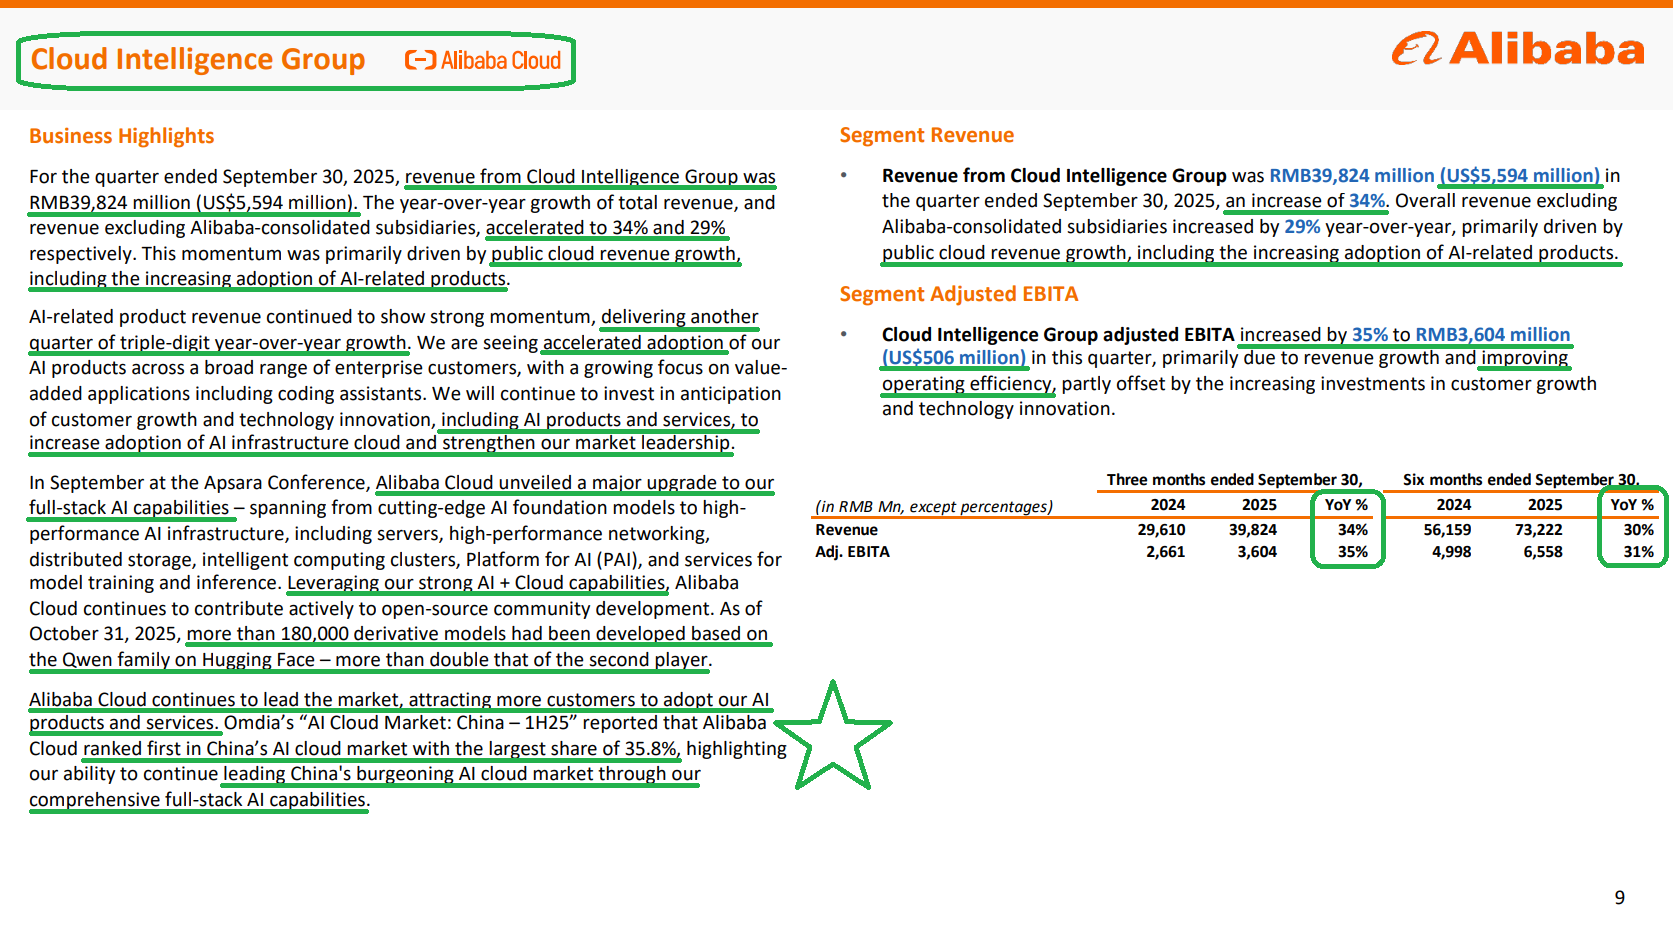
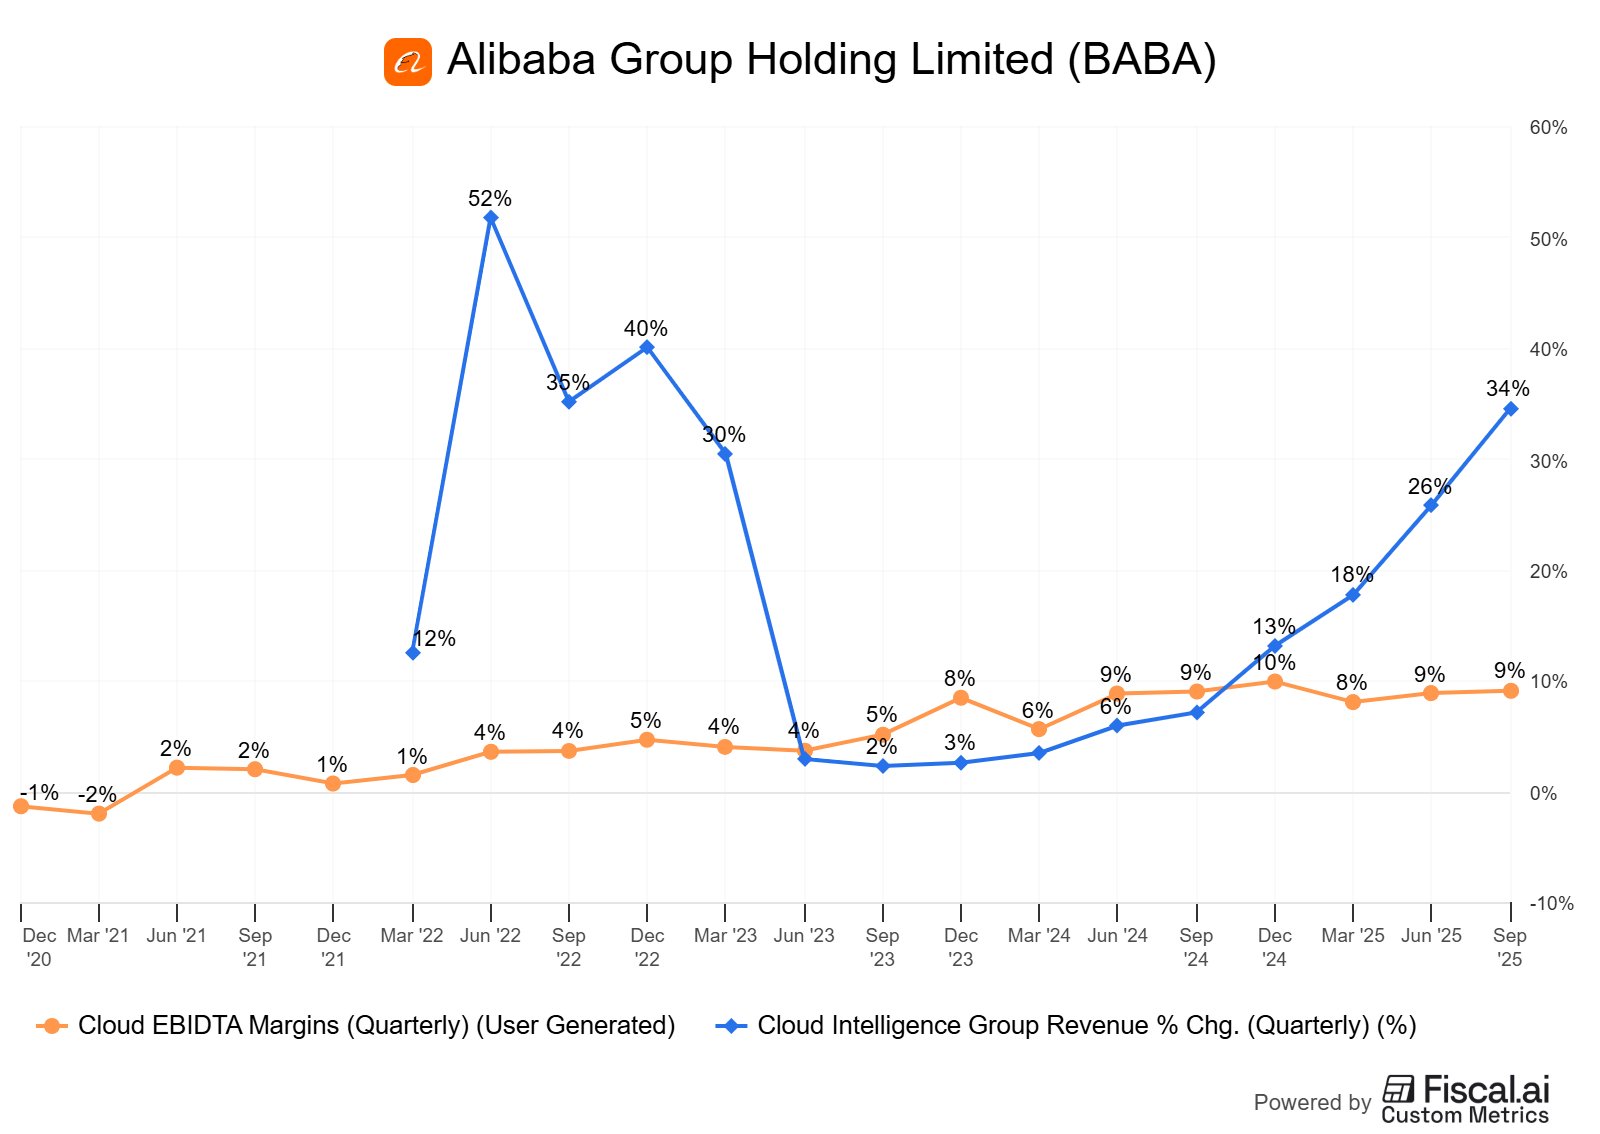
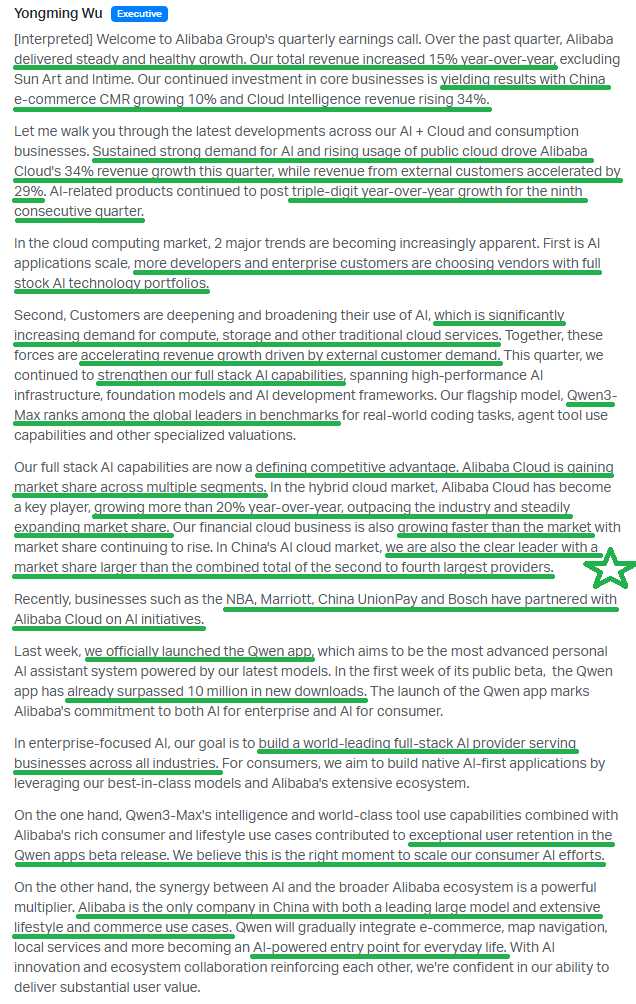
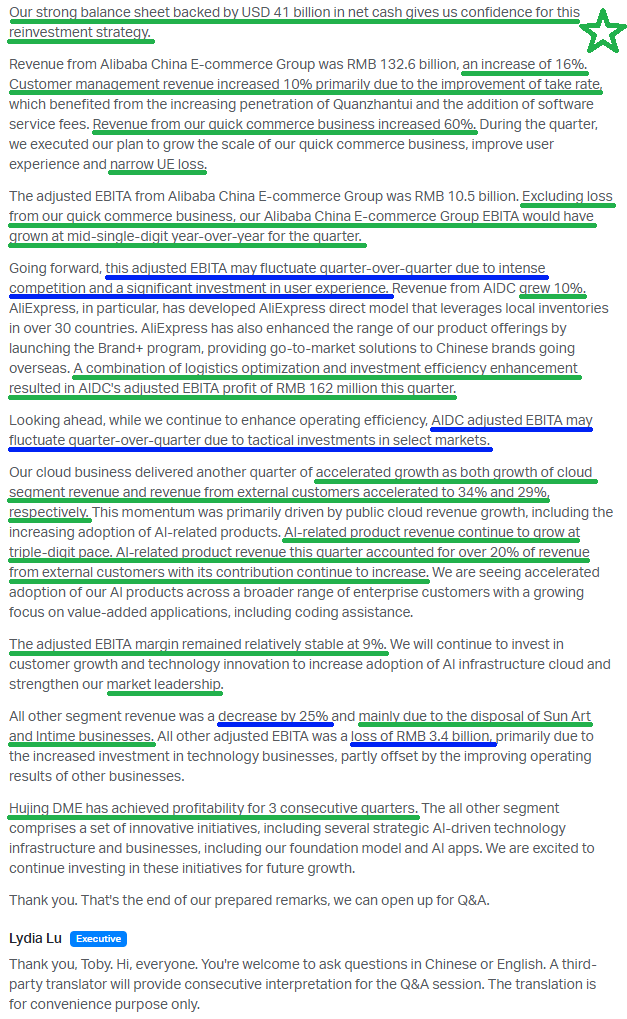
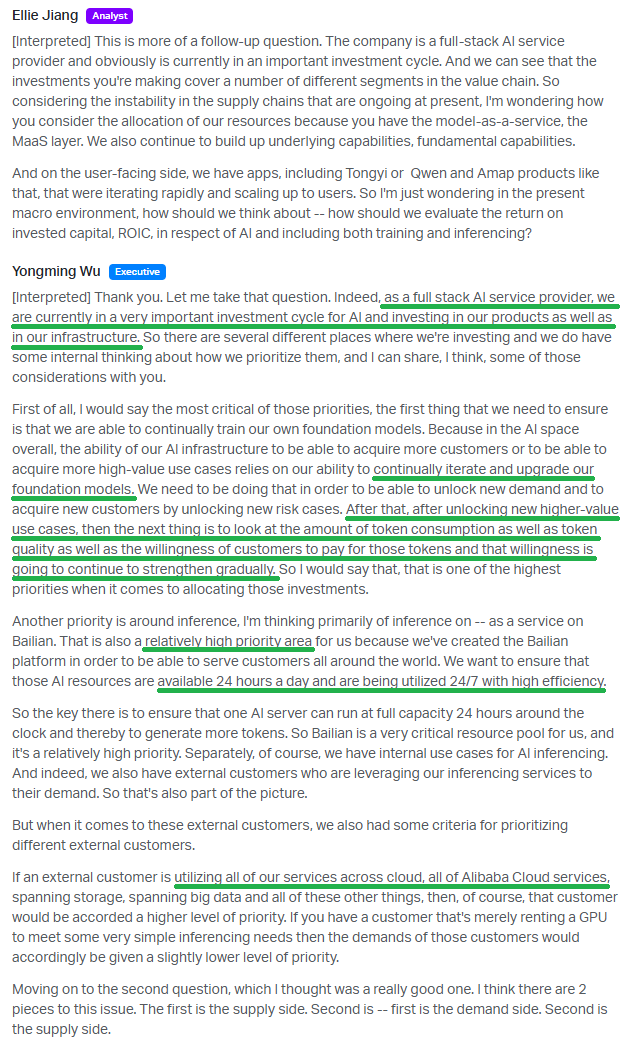
1) The Cloud segment posted its fastest growth in more than three years, accelerating to 34% YoY to $5.6 billion compared with 26% in the prior quarter. Adjusted EBITA rose 35% to $506 million, with margins holding steady at ~9% on improved operating efficiency. Alibaba Cloud remains the market leader, holding 35.8% share of China’s AI cloud market, larger than the combined total of the second through fourth largest providers, and continues to take share in both the hybrid cloud and financial cloud markets. With more developers and enterprises increasingly seeking full-stack AI providers, a key advantage for Alibaba, demand is now outpacing the pace at which the company can add new servers.
(Click on image to enlarge)
2) AI-related product revenue posted triple-digit growth for the ninth straight quarter and now accounts for more than 20% of the Cloud segment’s external revenue. Alibaba’s flagship AI model, Qwen 3, ranks among global leaders across multiple benchmarks, with the newly launched Qwen app already surpassing 10 million downloads in its first week. As of the end of October, more than 180k derivative models had been built on the Qwen family on Hugging Face, more than 2x the second-largest player.
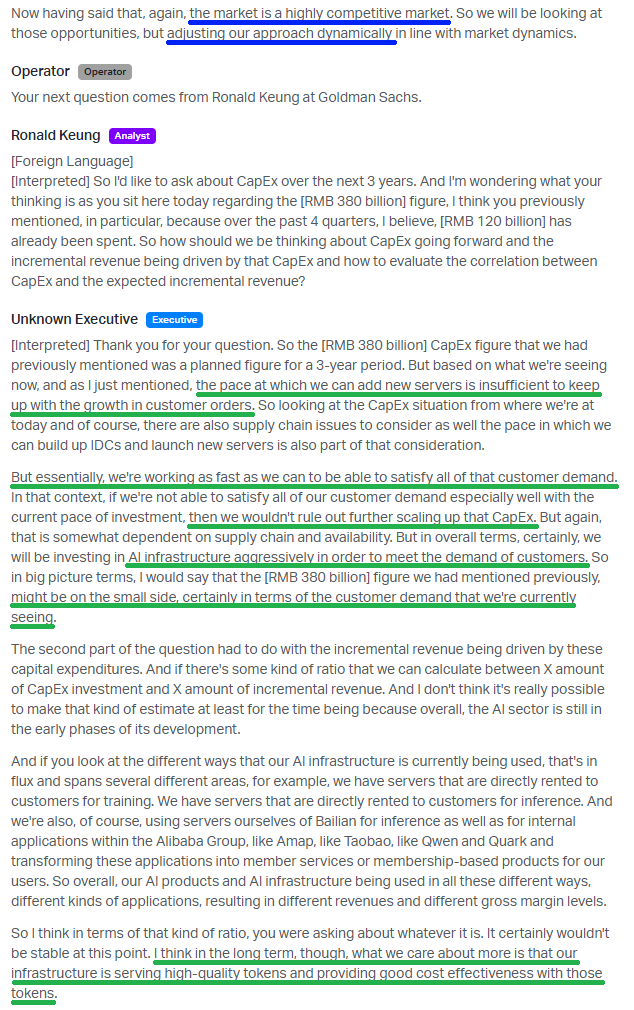
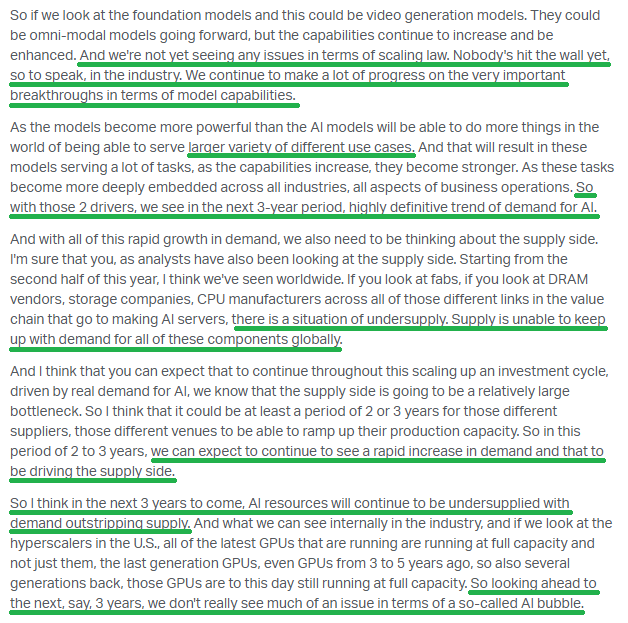
3) Over the past four quarters, management has deployed ~$16.9 billion in capex toward AI and Cloud infrastructure as part of Alibaba’s three-year $53 billion capex plan. Given current demand for compute and AI, management won’t rule out further scaling capex, suggesting the $53 billion target may end up on the small side.
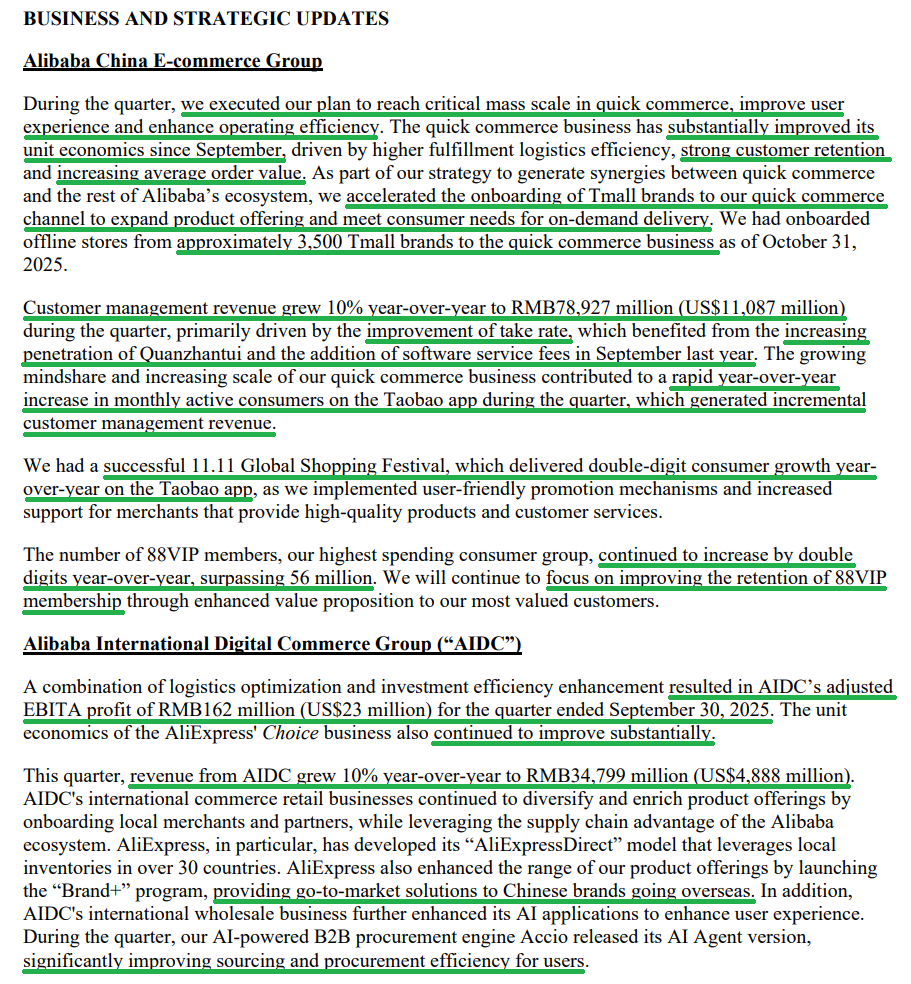
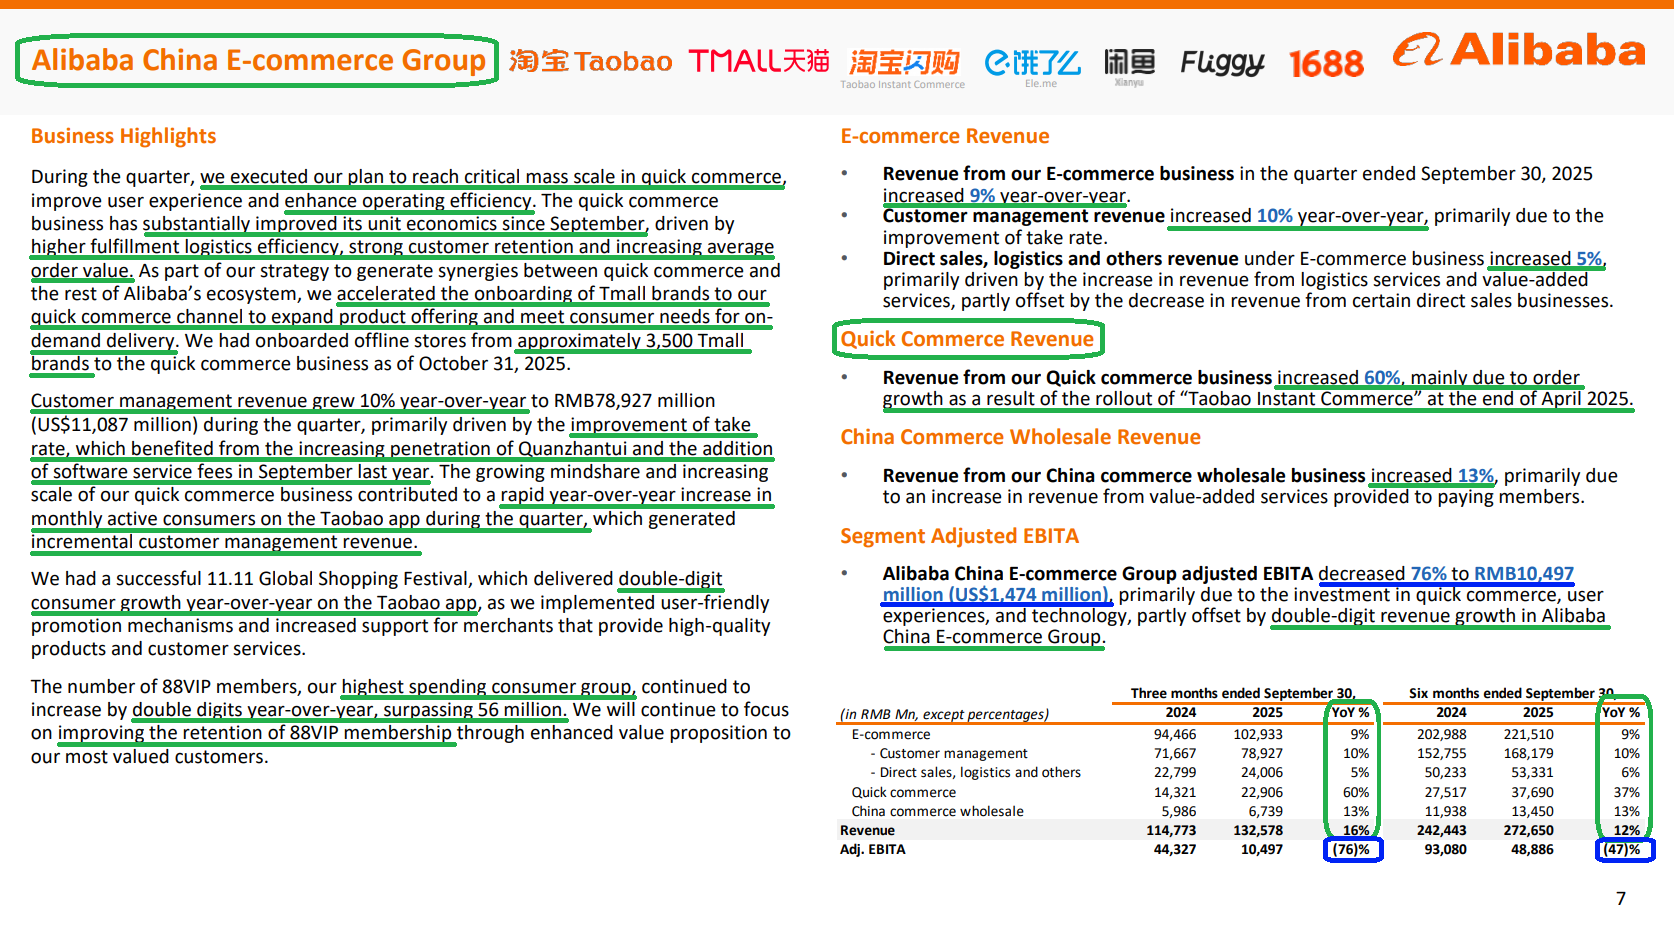
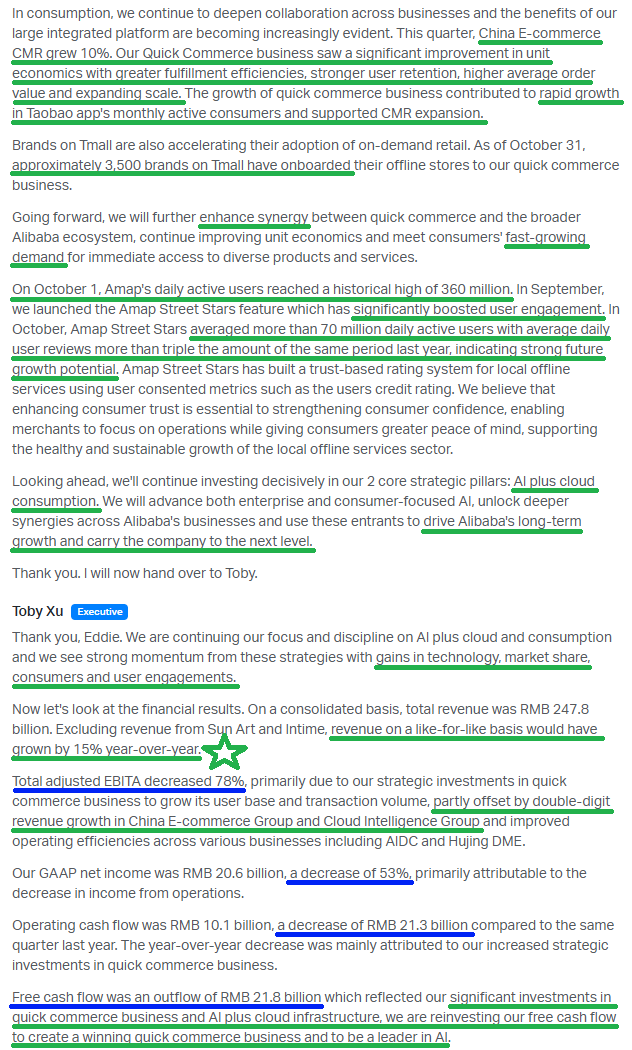
4) The China e-commerce group, which includes Taobao, Tmall, Ele.me, and Fliggy, posted 16% revenue growth to $18.6 billion, with customer management revenue up 10% driven by higher take rate, added software service fees (0.60% introduced last September), and increasing penetration of Quanzhantui, Alibaba’s marketing and ads platform. Segment adjusted EBITA decreased 76% to $1.5 billion, primarily due to increased quick-commerce investments. Excluding the losses from quick commerce, China e-commerce adjusted EBITA would have grown at a mid single-digit rate for the quarter. 88VIP members, Alibaba’s highest-spending customers and its closest equivalent to Amazon Prime, grew by double digits during the quarter and now exceed 56 million.
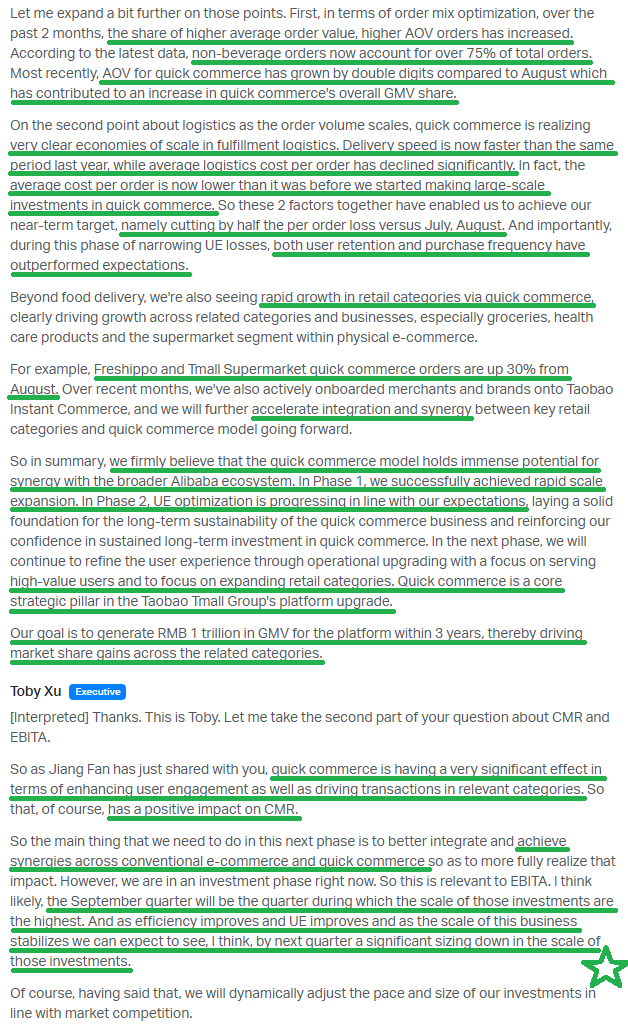
5) Alibaba’s quick commerce segment posted 60% revenue growth to $3.2 billion, supported by the accelerating onboarding of Tmall brands, which now total ~3,500. Most importantly, unit economic losses have been reduced by ~50% compared with levels seen in July and August, driven by higher average order size (up double digits) and improved scale efficiencies. While narrowing UE losses, management noted that both user retention and purchase frequency have exceeded expectations, with order share holding stable and GMV share steady to trending higher. Management believes this quarter marks the peak of investment intensity for the platform and expects a significant scaling down of investment next quarter. Instant commerce is still expected to deliver $140 billion in incremental annual GMV within three years.
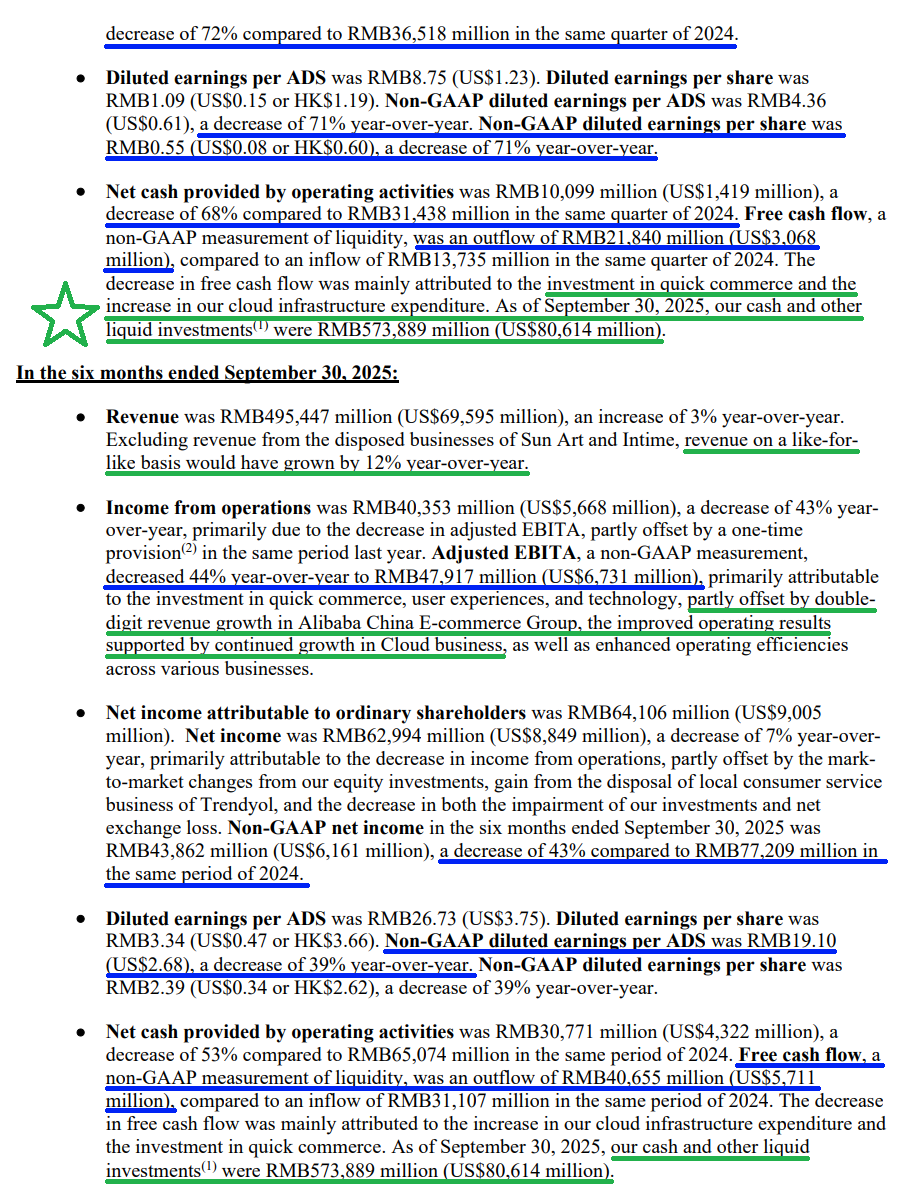
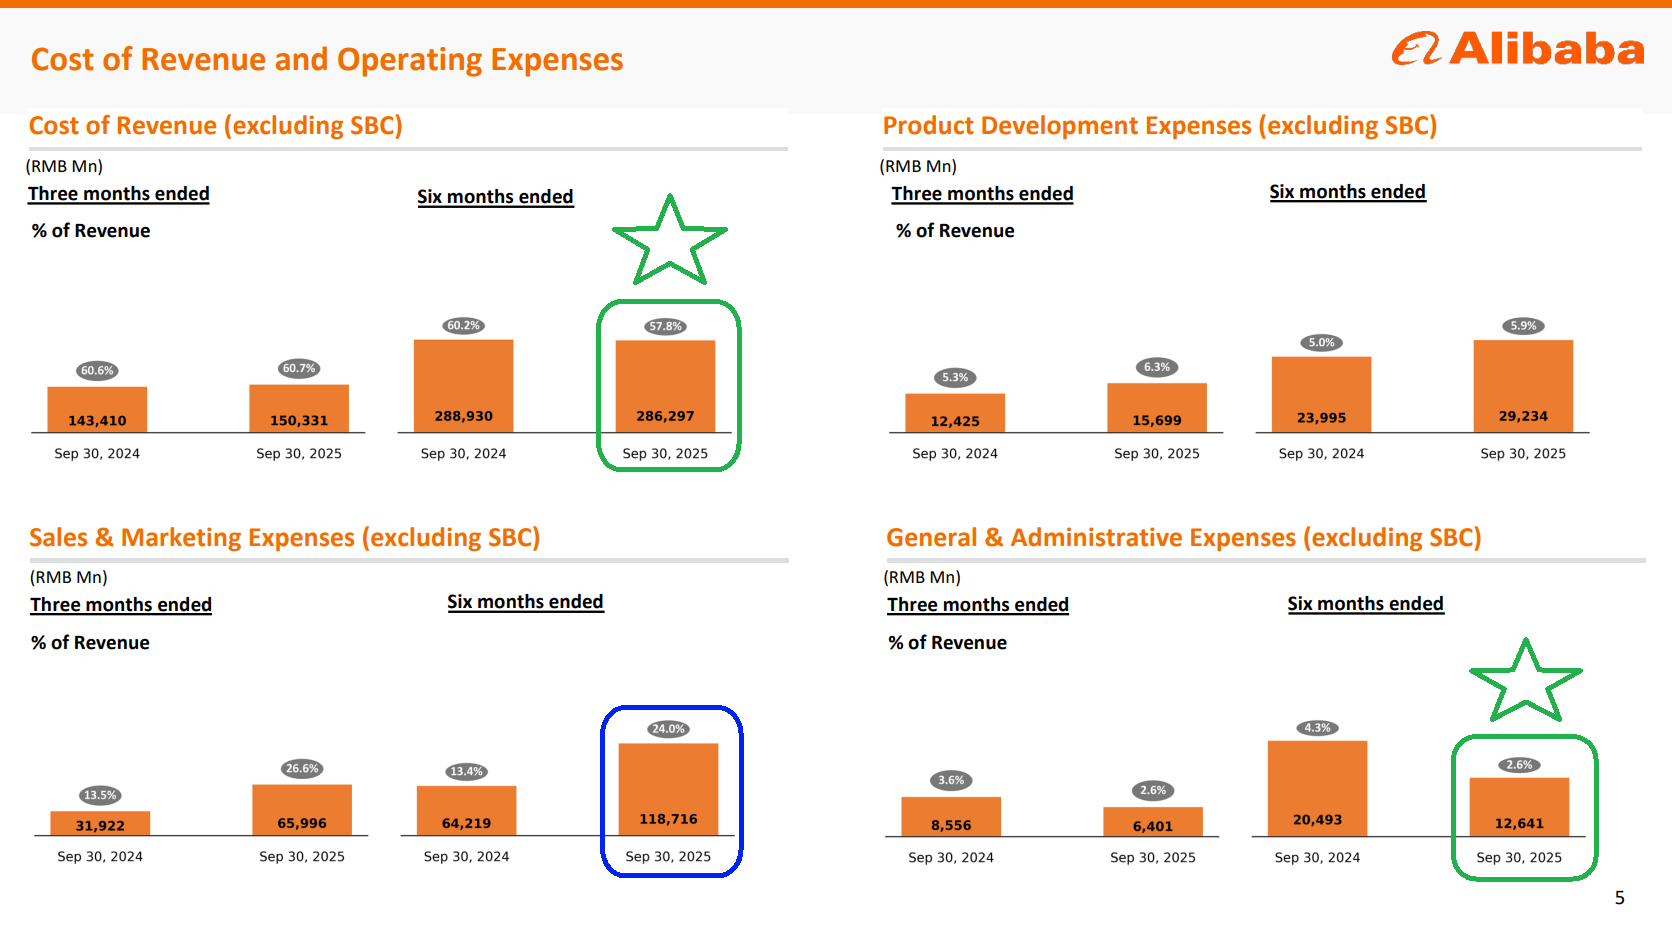
6) Profitability in the current period remained under pressure due to ongoing investments, mainly in quick commerce, with adjusted EBITA down 78% YoY to $1.27 billion and expected to fluctuate in the near term. Sales and marketing expenses year-to-date have risen to 24% of revenue compared with 13.4% at this point last year, driven by intense competition in the segment.
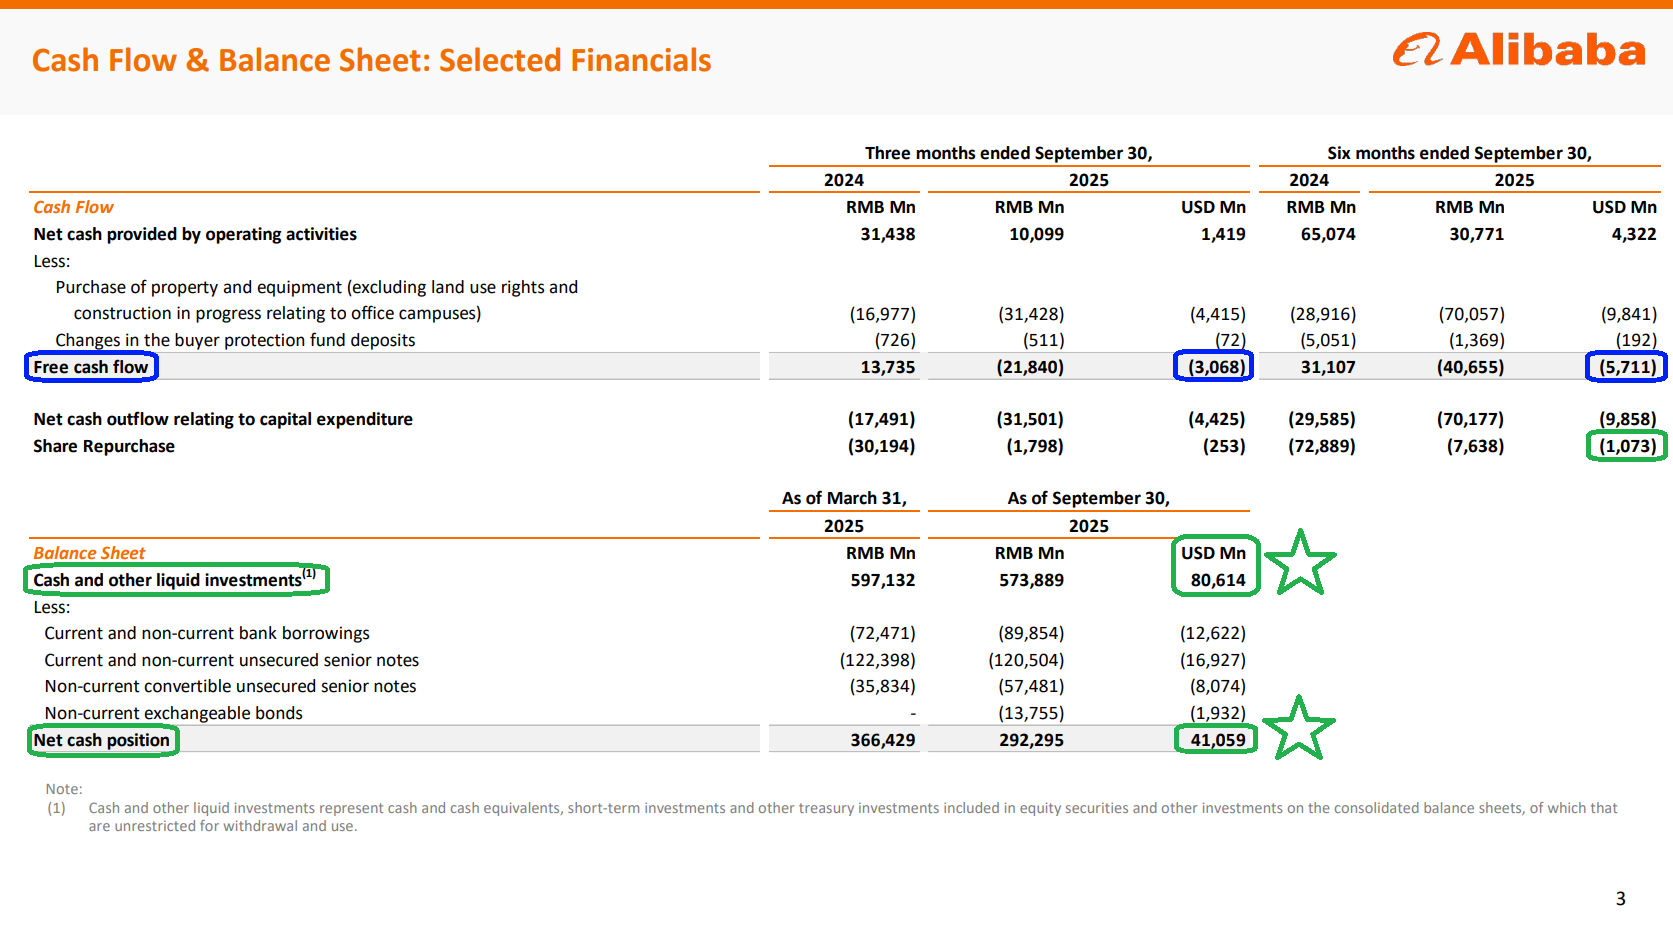
7) Alibaba’s strong balance sheet gives us plenty of confidence in the ramped-up investment cycle into quick commerce and AI-plus-cloud, with cash and other liquid investments totaling $80.6 billion (21.5% of market cap) and a net cash position of $41.1 billion.
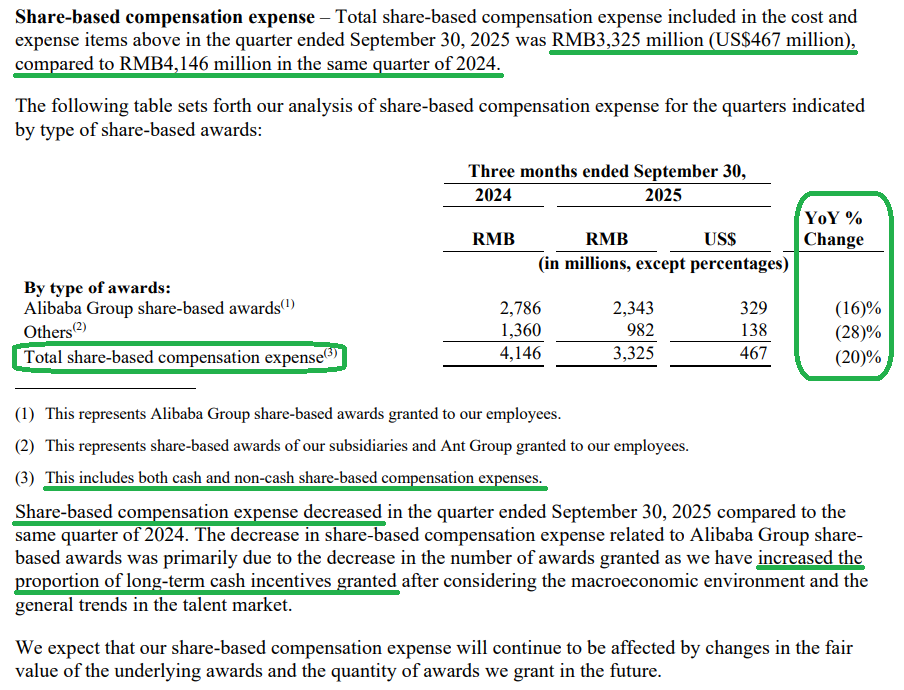
8) Management repurchased ~2 million shares during the quarter for a total of $253 million, bringing year-to-date repurchases to ~$1.1 billion, with $19.1 billion in remaining authorization effective through March 2027. This is exactly what we want to see from management. Last year, when the stock was at $80 and below, they were consistently repurchasing $4–5 billion per quarter. Now that the stock is significantly higher and capital has better uses, they have rightly pulled back on buybacks. Total share-based compensation also decreased 20% YoY to $467 million during the quarter, another positive sign.
9) Free cash flow for the quarter was an outflow of $3.1 billion, bringing year-to-date FCF to an outflow of $5.7 billion, in line with expectations as Alibaba reinvests into the quick commerce business and AI-plus-cloud infrastructure.
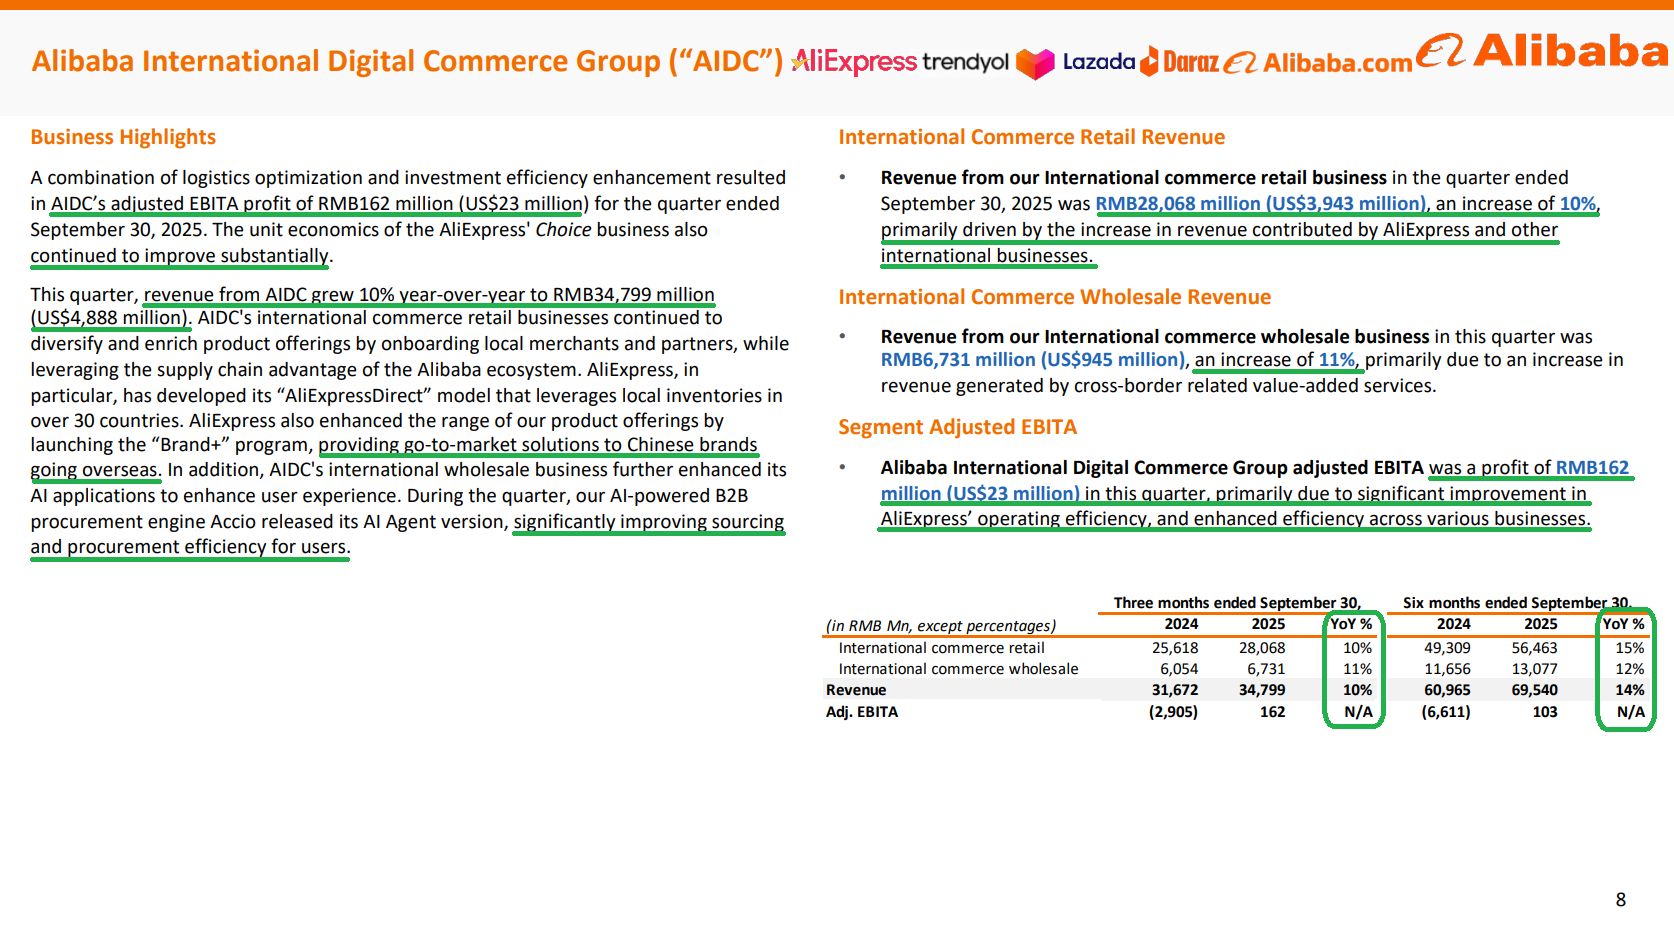
10) Alibaba International (AIDC) delivered 10% YoY revenue growth to $4.89 billion and, for the first time, posted an adjusted EBITA profit of $23 million, driven by substantially improved unit economics in the AliExpress Choice business and stronger operating efficiency.
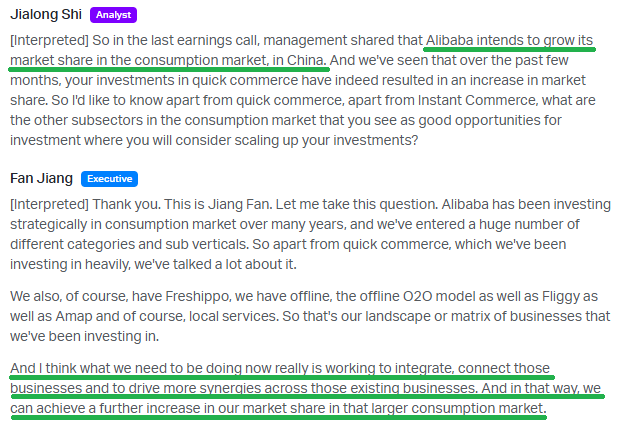
Earnings Call Highlights


General Market
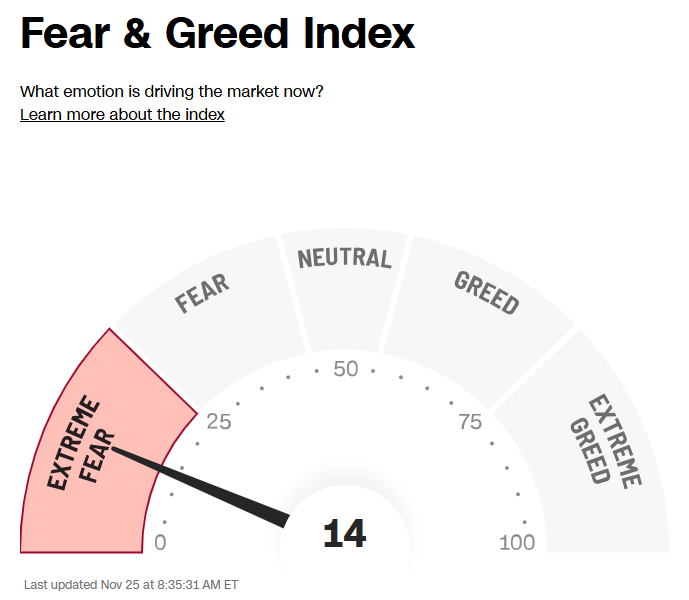
The CNN “Fear and Greed Index” ticked up to 14 this week from 9 last week. You can learn how this indicator is calculated and how it works here: (Video Explanation)
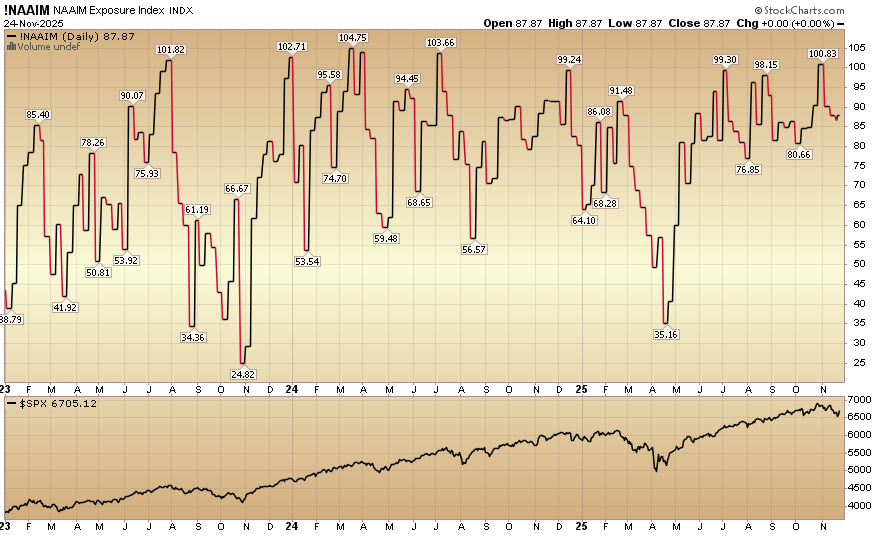
The NAAIM (National Association of Active Investment Managers Index) (Video Explanation) stayed unchanged at 87.87% equity exposure this week.
(Click on image to enlarge)
More By This Author:
“Don’t Let The Gloom Fool You” Stock Market (And Sentiment Results)
“Boring Never Looked So Good” Stock Market (And Sentiment Results)
“Turning The Corner” Stock Market (And Sentiment Results)


Comments
Log in or sign up to join the conversation.