
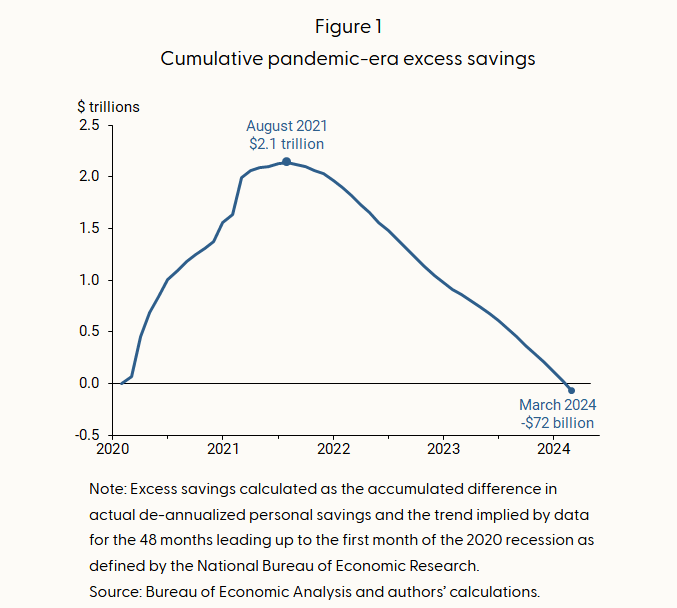
Personal consumption accounts for two-thirds of economic activity. Therefore, the means by which consumers can spend is essential for forecasting economic growth. The San Francisco Fed just released an article warning that a significant source of spending since the pandemic is no longer available. Per their article, Pandemic Savings Are Gone: What’s Next for U.S. Consumers?– “The latest estimates of overall pandemic excess savings remaining in the U.S. economy have turned negative, suggesting that American households fully spent their pandemic-era savings as of March 2024.“
Since 2021, GDP has grown by 2.93% on an annualized basis, about half a percent greater than during the post-financial crisis – pre-pandemic era. The $2.5 trillion of excess savings, boosted by fiscal stimulus, helped GDP grow above its natural rate. However, excess savings from the pandemic have been depleted. This does not spell imminent recession. However, it argues growth should return to pre-pandemic levels. Per the Fed article, consumers still have some savings and healthy income growth to support consumption.
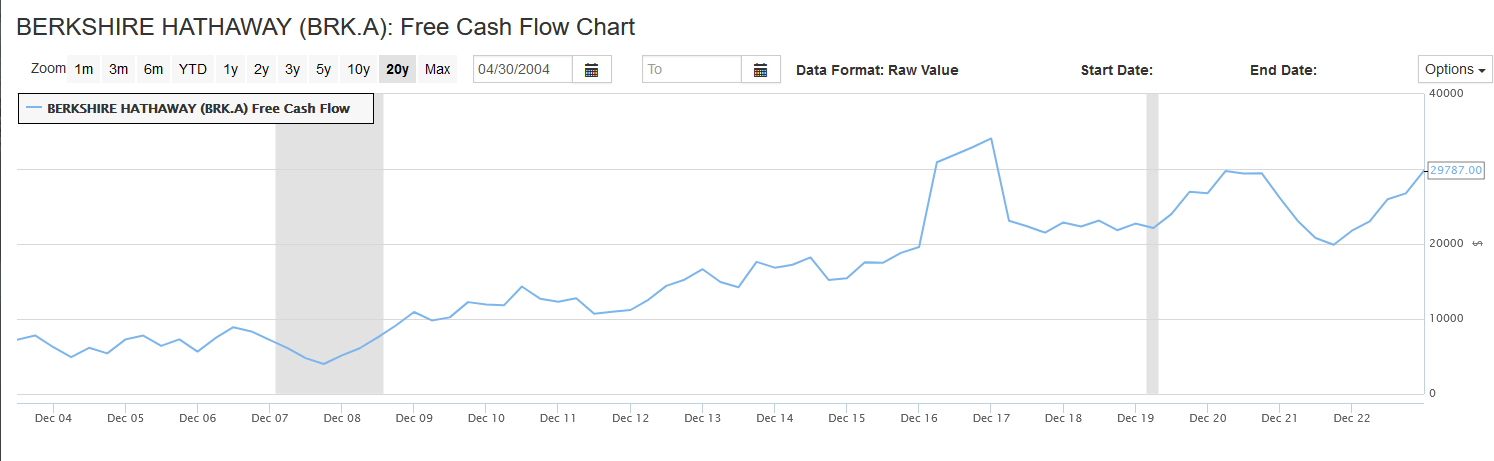
Berkshire Is Sitting On A Mountain Of Cash
At Berkshire Hathaway’s annual meeting this past weekend, Warren Buffett stated: “We only swing at pitches we like.” Accordingly, given that they are sitting on $189 billion in cash, they probably don’t like many investment ideas. Indeed, the 5% interest rate on cash lessens the opportunity cost of not being more fully invested. Buffett plans to use some excess cash to buy back its shares but admits the stock “isn’t that liquid, so it’s hard to do.”
The graph below shows that Berkshire generates nearly $30 billion of free cash flow a quarter. Unless Buffett puts cash to work, the amount of cash and marketable securities will continue to grow rapidly. Given that valuations are generally high and Buffett tends to have a value orientation, it’s quite likely that Berkshire will wait for a correction. At that time, they will have significant funds to supply liquidity to the market.
(Click on image to enlarge)
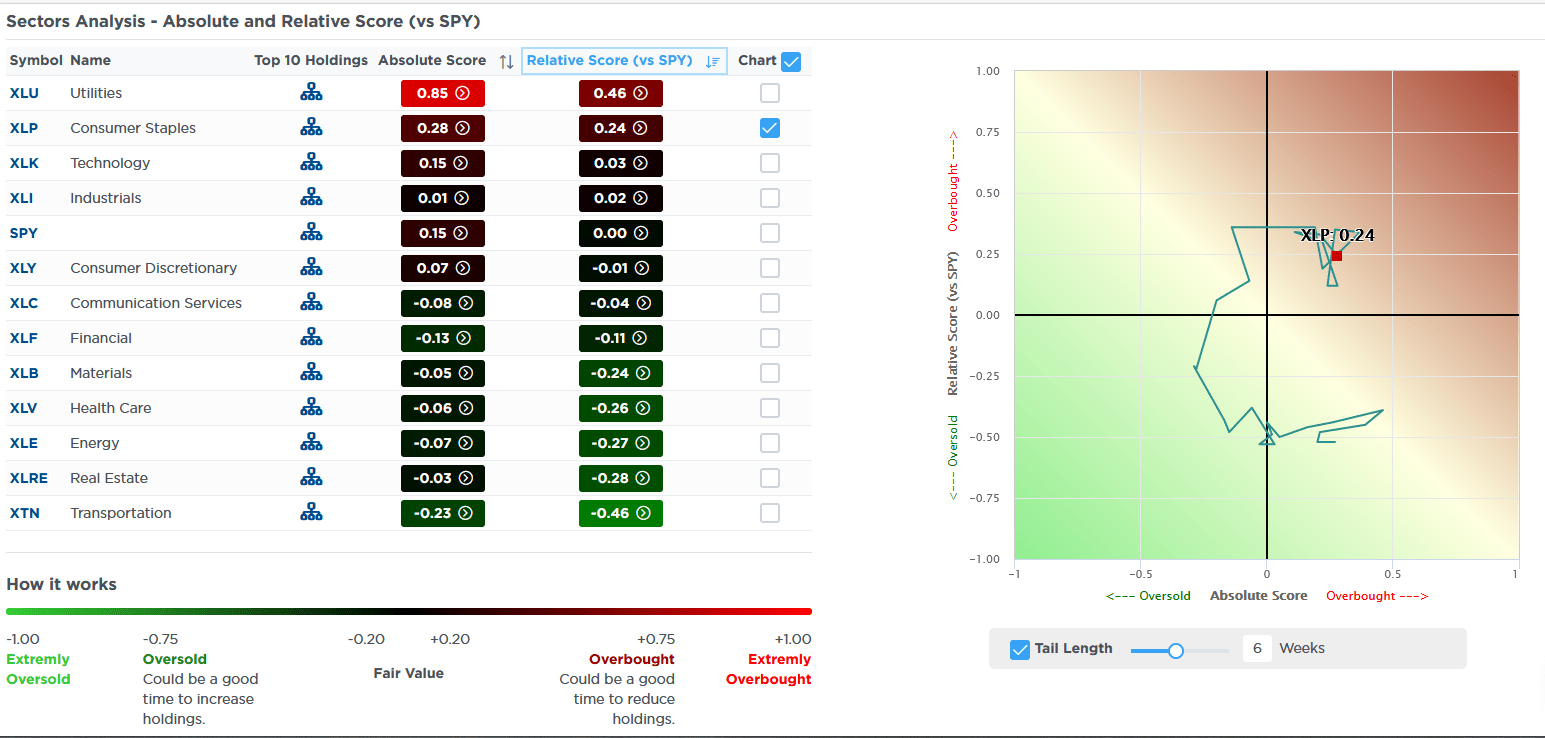
Staples Following Utilities Lead
Two weeks ago, we shared a SimpleVisor sector analysis, showing that the utility sector was leading the market. While the sector continues to outperform every other sector and the broader S&P 500, consumer staples (XLP) stocks are now following their lead. The first SimpleVisor graphic below highlights that staples are now the second most overbought sector behind utilities. The graph on the right side plots the rotation of its absolute and relative SV scores for the past six weeks. As we often find, stocks and sectors rotate from oversold on an absolute and relative basis to overbought. Currently, the staples sector is overbought but only moderately so. There is plenty of room to become more overbought.
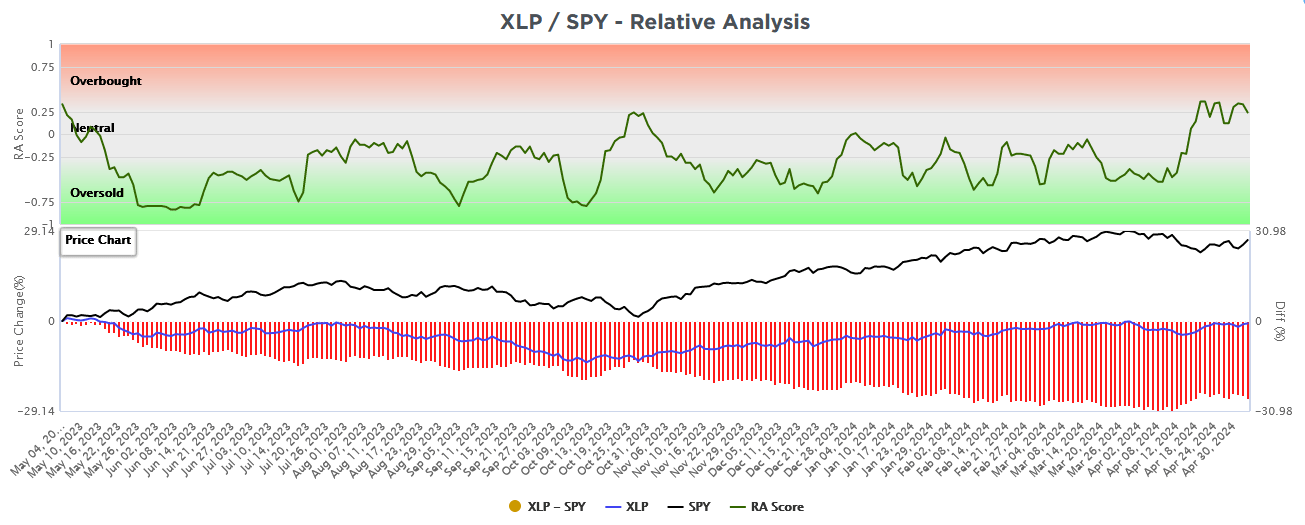
The second graph charts its relative score in the top graph. The bottom graph highlights the relative performance versus the S&P 500. As shown, its recent scores in the top graph are the highest or most overbought in a year. The relative performance of staples has been lousy this past year. However, that leaves plenty of room for it to catch up with the market.
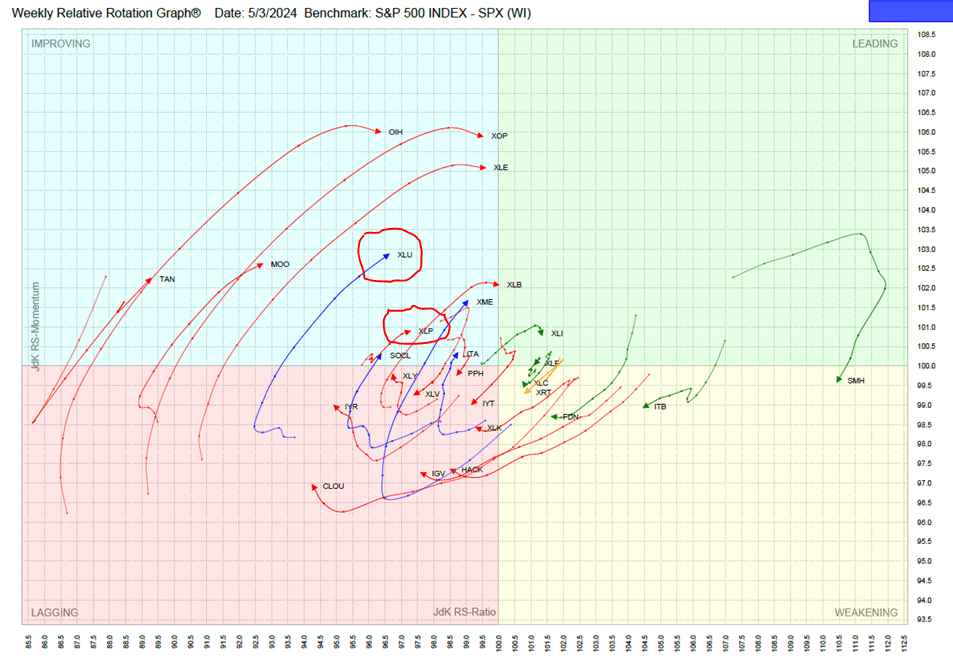
The third graph below is from the TPA weekly RRG report. TPA is a standalone service within SimpleVisor offering its subscribers a unique way to take advantage of sector and stock rotations. The third graph below from Monday’s relative rotation report shows the rotations of 27 sectors and subsectors. As we circle, utilities (XLU) and XLP are “improving” and likely headed toward the “leading” quadrant. TPA’s analysis argues that both sectors have more relative upside performance. The following link shows TPA’s RRG model and how sectors and subsectors move in and out of favor over time: https://youtu.be/jl7nGbZKWa0
(Click on image to enlarge)
(Click on image to enlarge)
(Click on image to enlarge)
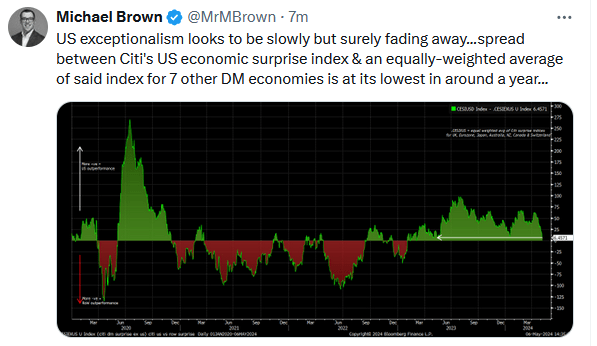
Tweet of the Day
. Higher asset prices may also help. Lastly, per the Fed: “Consumers could use debt—such as credit cards and personal loans—to further support their current spending habits, although the current elevated interest rate environment means that the cost of using credit is higher than in the decade preceding the pandemic recession.“
(Click on image to enlarge)
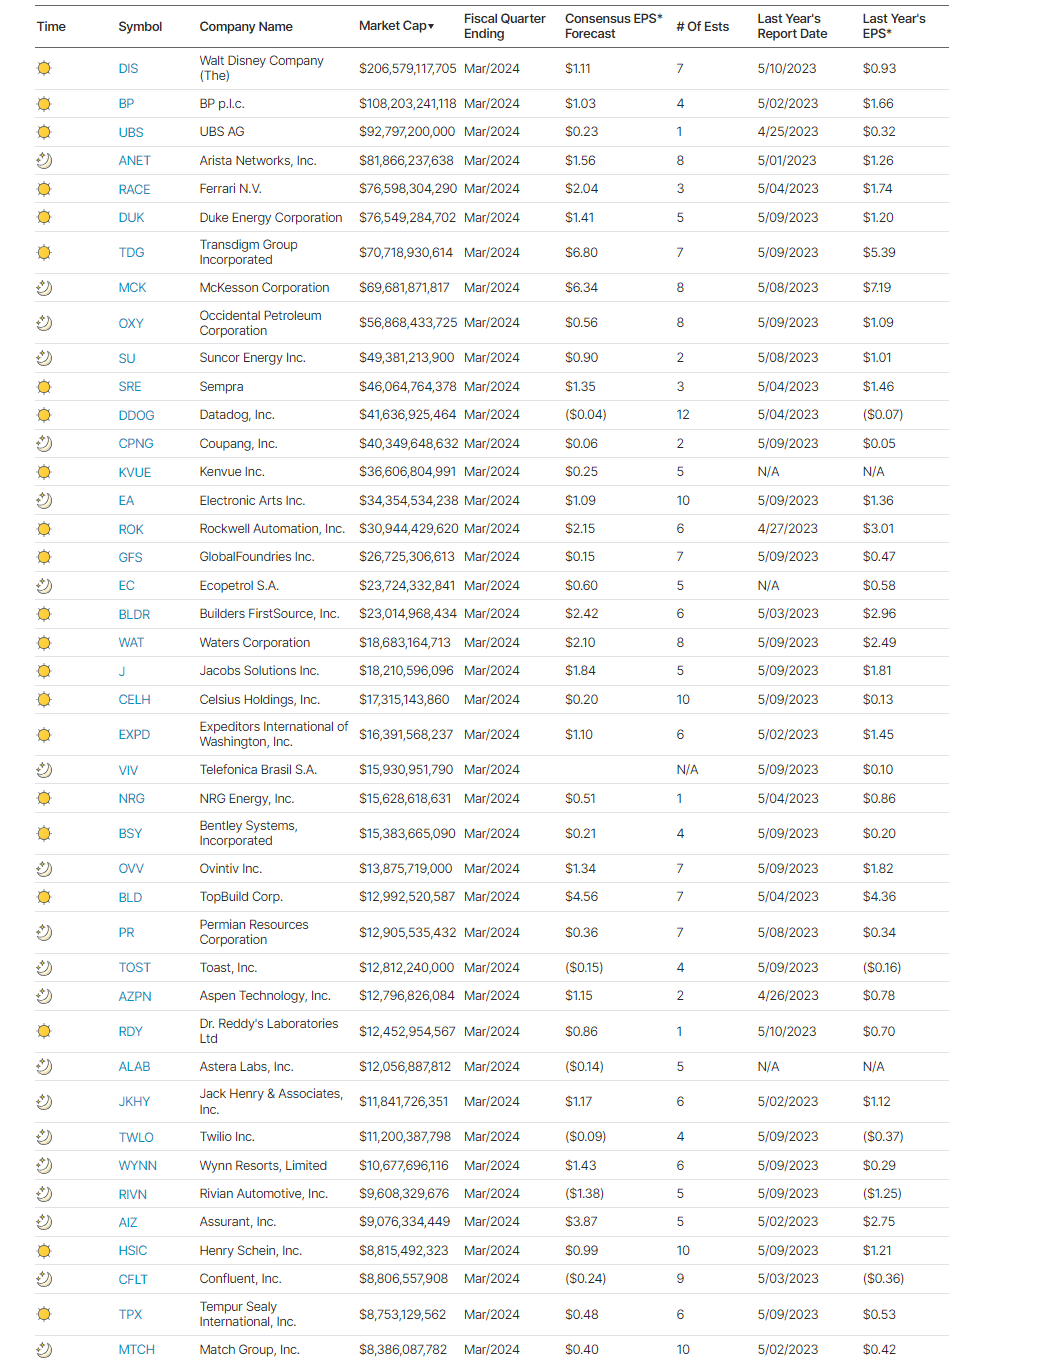
What To Watch Today
Earnings
(Click on image to enlarge)
Economy
- No notable economic reports today
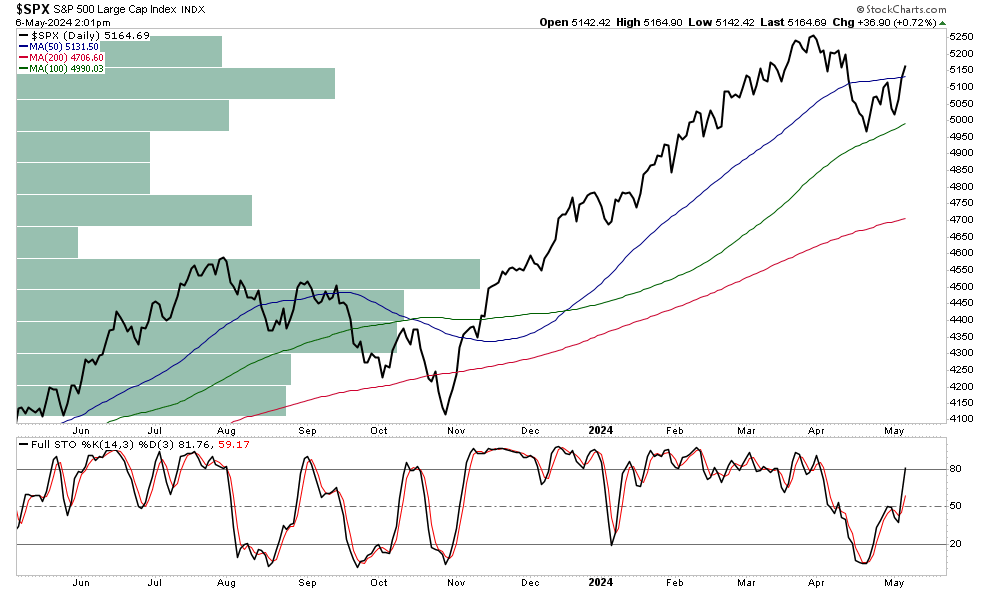
Market Trading Update
In yesterday’s commentary, we noted the market was on the verge of breaking above resistance at the 50-DMA. Furthermore, in yesterday’s blog, we laid out 3-potential market outcomes. To wit:
“The stock rally is at a critical juncture, and what happens next will determine whether the current market correction is over. Three possible scenarios over the next month or so exist.
Path A: The market breaks above the 50-DMA and retests previous highs. While this path is indeed possible, the markets are overbought on a very short-term basis, suggesting further price appreciation will become more challenging.
Path B: Many investors were surprised by the recent market decline. As such, these “trapped longs” will likely use the current stock rally as an opportunity to reduce risk. Another retest of the 100-DMA seems probable before the next leg of the current bull rally ensues.
Path C: With earnings season mostly behind us and stock buybacks set to resume, a reversion to the 200-DMA seems the least probable. However, as is always the case, it is a risk that we should not ignore. A sharp uptick in inflation or stronger-than-expected economic data could spark concerns about a “higher for longer” Fed policy. Such an event would likely lead to a further repricing of risk assets.“
(Click on image to enlarge)
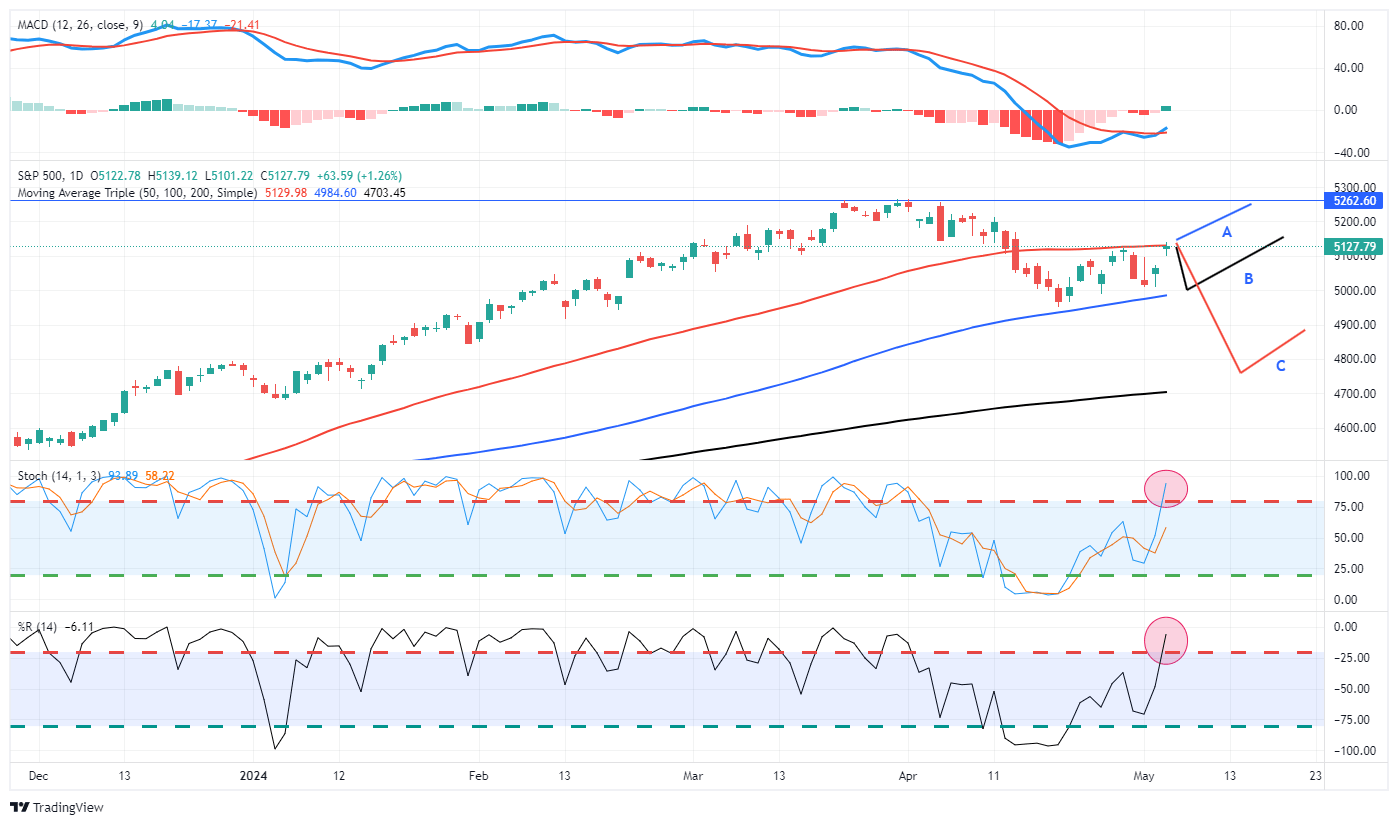
Yesterday, the market broke above the 50-DMA, putting “Path A” as the potential scenario to consider in the near future. However, if it is going to be confirmed, the market must maintain that breakout through Friday. A failure in the next day or so that takes the market back below the 50-DMA will be considered a “failed breakout,” reinforcing resistance at the 50-DMA. In such an event, expect a retest of the 100-DMA shortly thereafter.
The bullish case is improving short-term, but continue to manage risk until the break above the 50-DMA is confirmed.
(Click on image to enlarge)
More By This Author:
A Stock And Bond Friendly Labor ReportStock Rally As Powell Sparks A Buying Frenzy
Stagflation - Myth Or Reality?


Comments
Log in or sign up to join the conversation.