
Elliott Wave Technical Forecast: Nasdaq Index
Nasdaq Elliott Wave Analysis | Trading Lounge
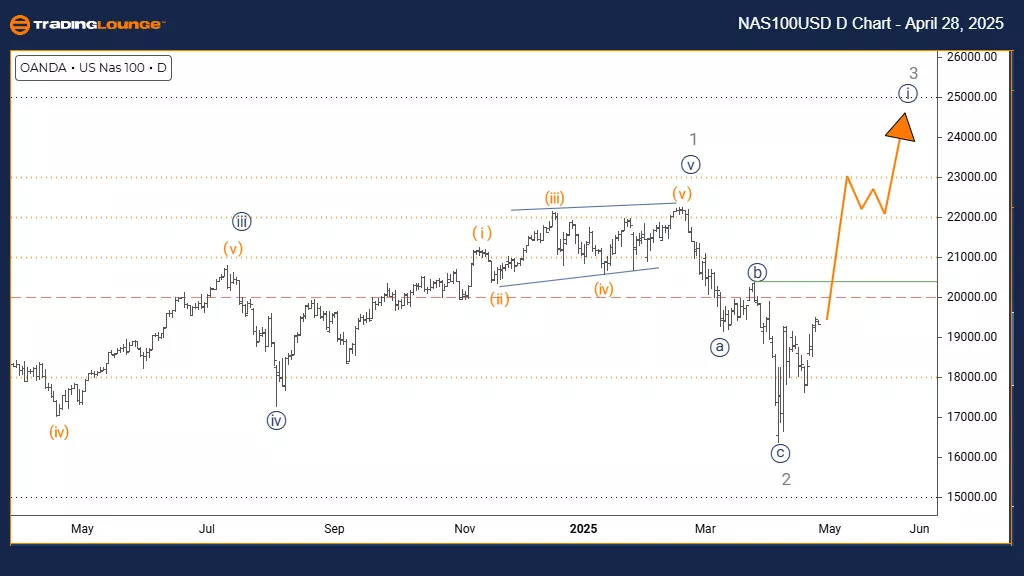
Nasdaq – Day Chart
Nasdaq Elliott Wave Technical Analysis
Function: Bullish Trend
Mode: Impulsive
Structure: Navy Blue Wave 1
Position: Gray Wave 3
Direction Next Lower Degrees: Navy Blue Wave 2
Details:
Gray wave 2 appears complete, and navy blue wave 1 of 3 is now unfolding.
The Nasdaq daily chart analysis highlights a bullish trend forming through an impulsive Elliott Wave structure. The index has finalized the gray wave 2 correction and transitioned into navy blue wave 1 within the broader gray wave 3 formation. This setup signals the early phase of a new impulse move that could drive strong upside momentum over the upcoming sessions.
Navy Blue Wave 1 Progression
Navy blue wave 1 marks the initial segment of this new impulsive movement, typically featuring growing momentum as the market builds directional strength. The completion of the gray wave 2 correction provides the groundwork for wave 1's development, which usually progresses steadily without yet reaching explosive levels. The present structure suggests that the upward movement will unfold gradually before leading into the next corrective phase.
The transition into gray wave 3 at a higher degree implies stronger momentum ahead, making this initial phase significant for positioning strategies aimed at capturing future gains. The daily time frame gives important insights into the emerging structure, with wave 1 offering early opportunities in the broader bullish trend.
Trading Strategy and Market Outlook
Market participants should observe wave 1 for typical signs, such as rising trading volume and steady price movement. This phase may show more moderate growth compared to later impulse waves, which tend to be more aggressive. Technical indicators and price action signals will play a key role in confirming the evolving wave structure.
The next expected move will be the formation of navy blue wave 2 after navy blue wave 1 completes. This upcoming corrective phase could offer a valuable pullback opportunity before a potentially stronger wave 3 advance. Careful monitoring of price patterns and momentum indicators will be crucial for identifying the shift from wave 1 to wave 2.
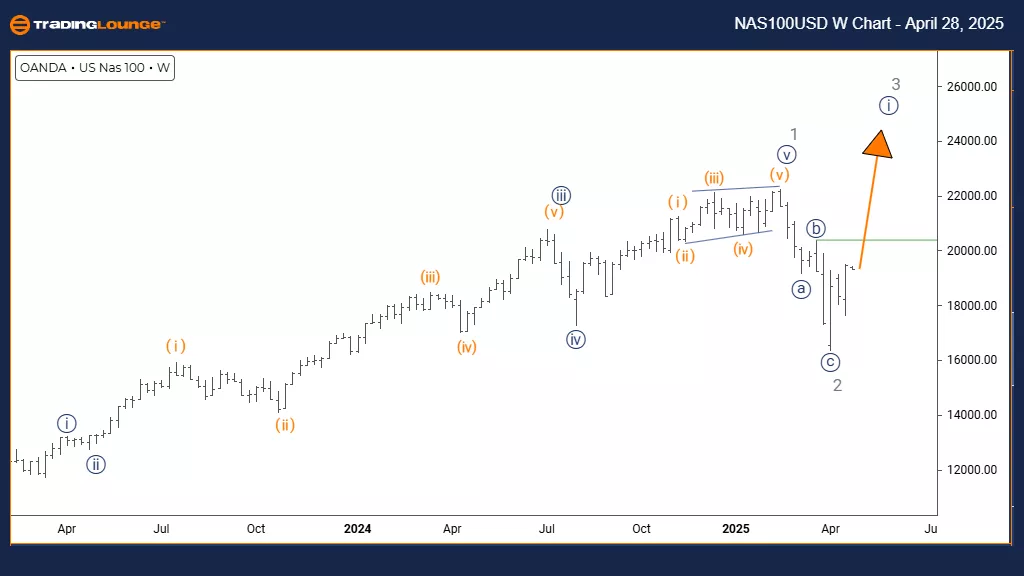
Nasdaq – Weekly Chart
Nasdaq Elliott Wave Technical Analysis
Function: Bullish Trend
Mode: Impulsive
Structure: Navy Blue Wave 1
Position: Gray Wave 3
Direction Next Lower Degrees: Navy Blue Wave 2
Details:
Gray wave 2 appears complete, and navy blue wave 1 of 3 is now unfolding.
The Nasdaq weekly chart analysis shows a bullish trend taking shape through an impulsive Elliott Wave structure. The index has finished the gray wave 2 correction and transitioned into navy blue wave 1, part of the larger gray wave 3 formation. This setup points to the early stages of what could evolve into a strong impulse wave with substantial upside potential over the coming weeks.
Navy Blue Wave 1 Development
Navy blue wave 1 signifies the first phase of the new impulsive movement, generally marked by steady price gains as the market builds conviction. Completing gray wave 2’s correction has created favorable conditions for navy blue wave 1’s development, which often gains strength gradually before more forceful moves emerge in later waves. The weekly timeframe suggests this phase could signal the start of a medium-term bullish trend.
The current structure highlights the index moving into what may become a powerful gray wave 3 at a higher degree, with navy blue wave 1 forming its foundation. This setup usually precedes vigorous trending behavior, as wave 3 is often the most dynamic phase in Elliott Wave patterns. Traders should watch for traditional early wave 1 signals like strengthening technical indicators and rising volume.
Trading Strategy and Market Outlook
Once navy blue wave 1 completes, a corrective navy blue wave 2 is expected before the continuation of the uptrend into wave 3. The weekly view emphasizes the importance of this unfolding structure, suggesting that traders should monitor price action closely for confirmations of wave progressions. This analysis indicates that the Nasdaq may be entering a favorable period for trend-following strategies aimed at capturing medium- to long-term gains.
Technical Analyst: Malik Awais
More By This Author:
SP500, Big Tech Stocks — Wave Counts, Trade Setups, Key Earnings Drivers
Elliott Wave Technical Forecast: Newmont Corporation - Friday, April 25
Elliott Wave Technical Analysis: Spotify Technology S.A.
At TradingLounge™, we provide actionable Elliott Wave analysis across over 200 markets. Access live chat rooms, advanced AI & algorithmic charting tools, and curated trade ...
more

