

Image Source: Unsplash
Zscaler Inc., Elliott Wave Technical Analysis
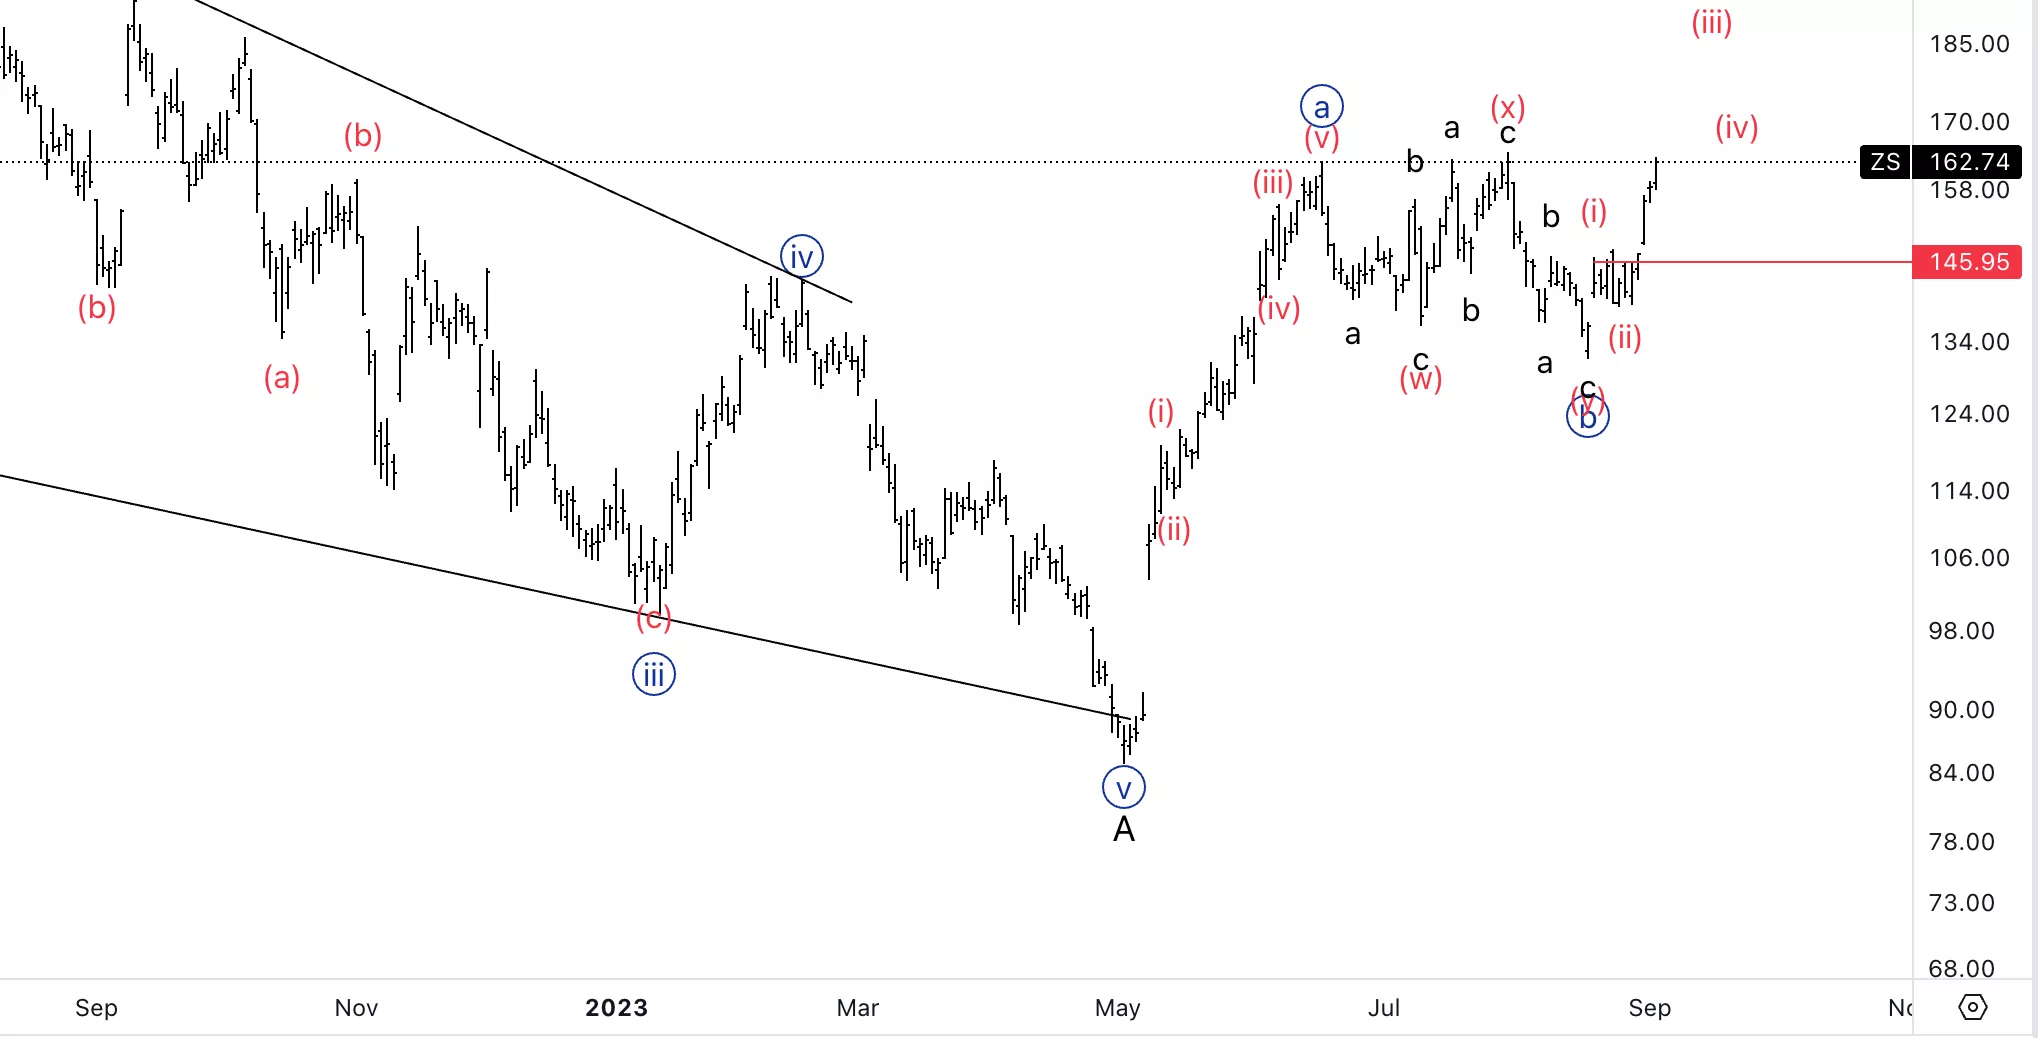
Zscaler Inc., (Nasdaq: ZS): Daily Chart, 5 September 2023
ZS Stock Market Analysis: We have been monitoring Zscaler for quite some time as it was looking like a clear potential three wave move to the upside which could represent a great buying opportunity. While we still stand within the area-range of wave {b} it looks like we could have found a bottom, as we also anticipated last week.
ZS Elliott Wave Count: Wave (iii) of {c}.
ZS Technical Indicators: Above all averages.
ZS Trading Strategy: Looking for longs into wave {c}.
Analyst: Alessio Barretta
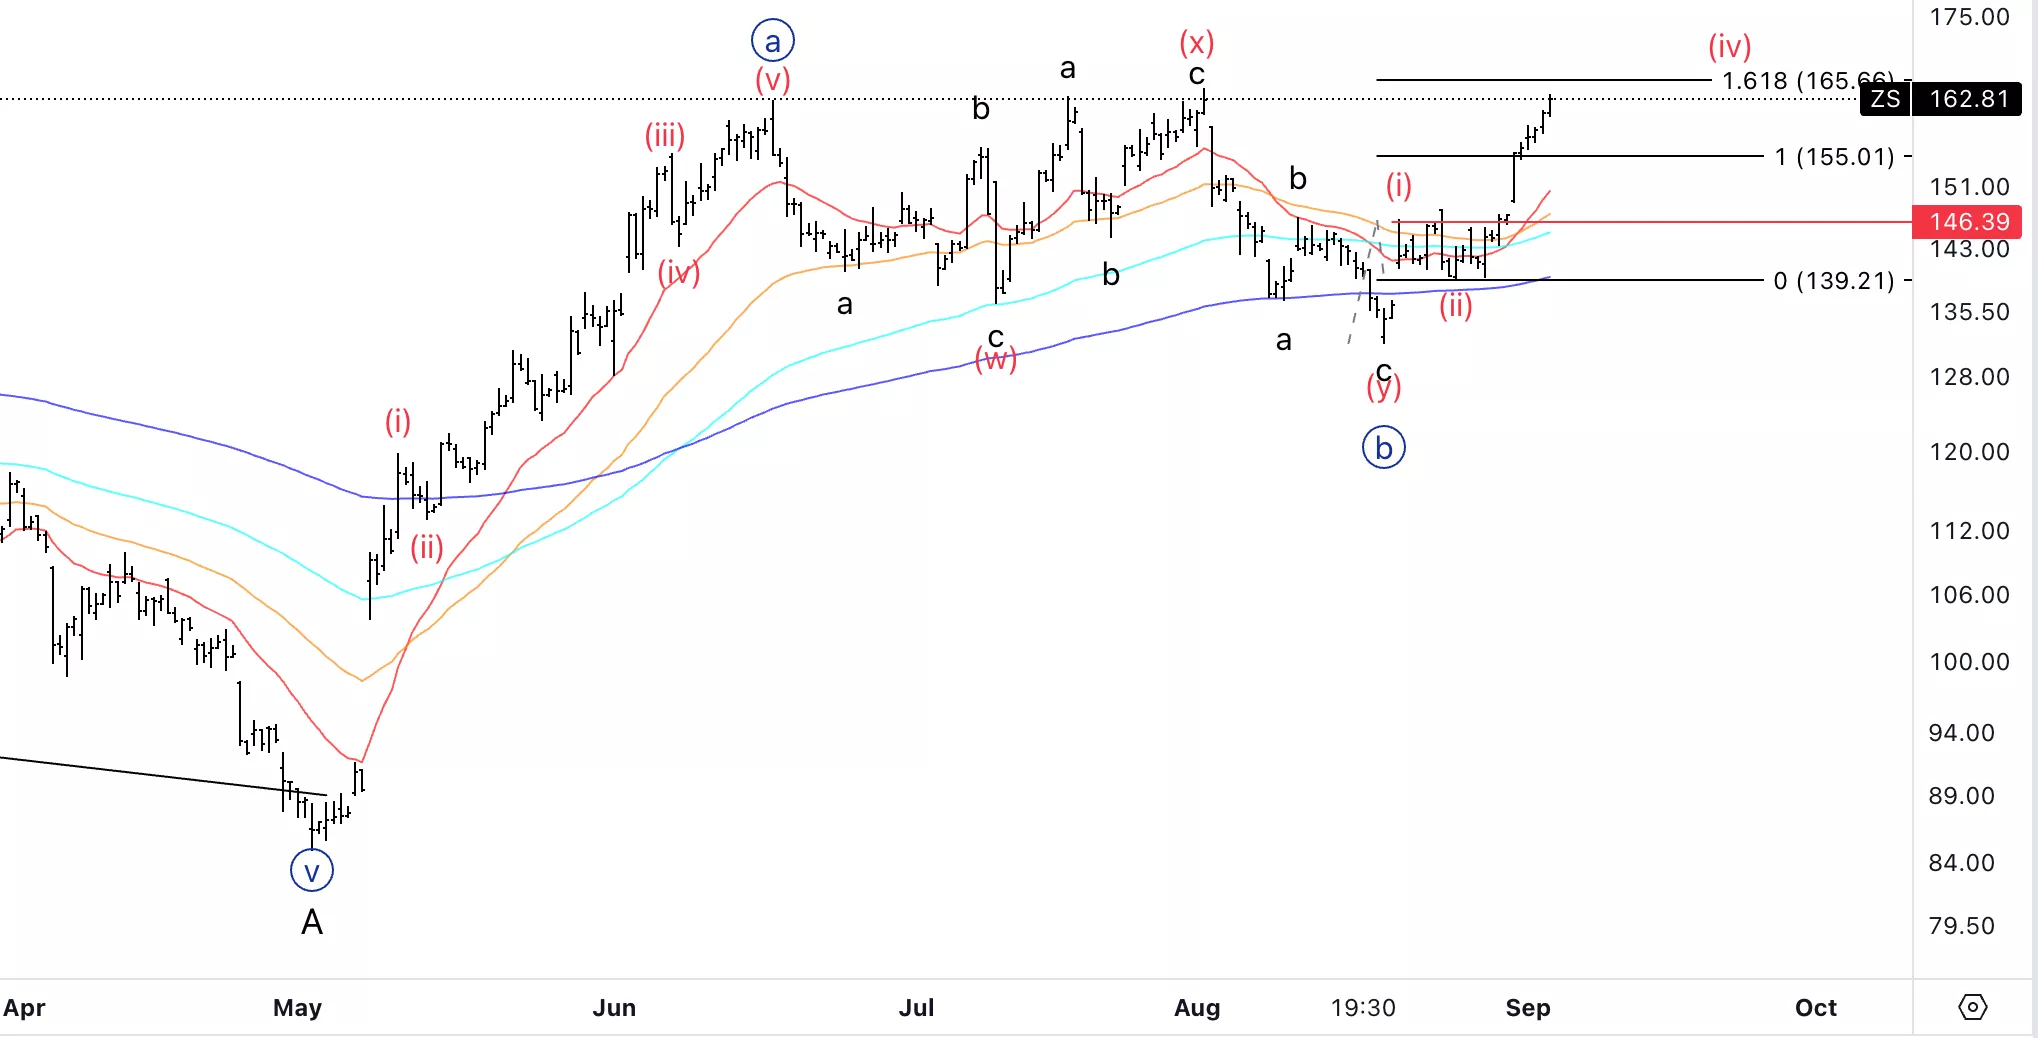
Zscaler Inc., ZS: 4-hour Chart, 5 September 2023
Zscaler Inc., Elliott Wave Technical Analysis
ZS Stock Market Analysis: We can see how wave (iii) currently stands near the 1.618 (iii) vs. (i). Looking for 165$ to be reached before seeing any signs of weakness. We could be looking for longs on wave (iv) if we see the downside is corrective in nature.
ZS Elliott Wave count: Wave (iii) of {c}.
ZS Technical Indicators: Above all averages.
ZS Trading Strategy: Looking for longs after wave (iv).
More By This Author:
Elliott Wave Technical Analysis 4 Hour Chart: New Zealand Dollar/U.S. Dollar - Tuesday, Sept. 5
Elliott Wave Technical Analysis Day Chart - New Zealand Dollar/U.S. Dollar
Elliott Wave Technical Analysis: Bitcoin/U.S. Dollar - Tuesday, Sept. 5


Comments
Log in or sign up to join the conversation.