
Zscaler Inc., Elliott Wave Technical Analysis
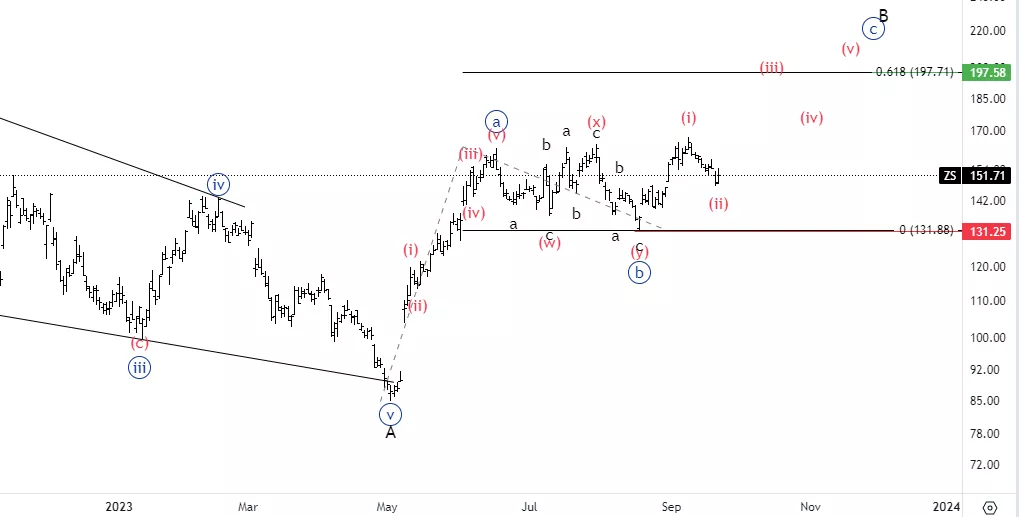
Zscaler Inc., (ZS): Daily Chart, 25 September 23
ZS Stock Market Analysis: We have been monitoring this stock as we were mainly looking for continuation higher after what seemed to be an initial move to the upside followed by a corrective downward move. At this stage the main scenarios are two. Either we just made wave (i) of {c} and we are looking to resume higher or else we’ve had a short wave {c} and we could be continuing lower.
ZS Elliott Wave Count: Wave (ii) of {c}.
ZS Technical Indicators: 20EMA as support.
ZS Trading Strategy: Looking for longs into wave (iii).
(Click on image to enlarge)
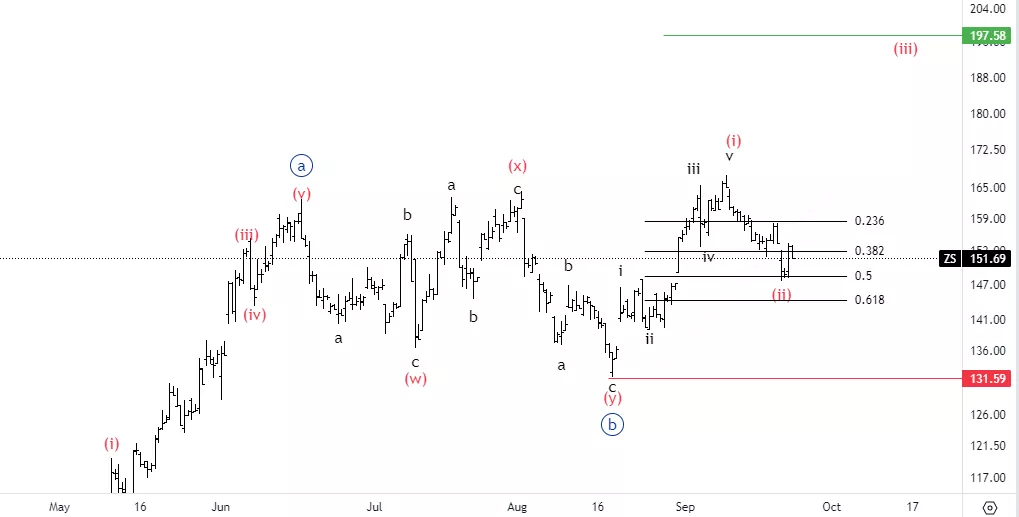
Zscaler Inc., ZS: 4-hour Chart, 25 September 23
Zscaler Inc.,Elliott Wave Technical Analysis ZS Stock Market Analysis: Looking for a potential three wave move into wave (ii) to then have additional confirmation of upside resumption. We currently stand at the 50% retracement, with invalidation below wave (i).
ZS Elliott Wave count: Wave (ii) of {c}.
ZS Technical Indicators: Between averages.
ZS Trading Strategy: Looking for longs after upside confirmation.
(Click on image to enlarge)
More By This Author:
Day Chart Elliott Wave Technical Analysis: USD/CAD
Elliott Wave Technical Analysis: Bitcoin/U.S. Dollar - Monday, Sept, 25
Stock Trading: AAPL, AMZN, NVDA, TSLA, GOOGL, META, NFLX, MSFT


Comments
Log in or sign up to join the conversation.