

Image Source: Pixabay
Texas Instruments Inc., Elliott Wave Technical Analysis
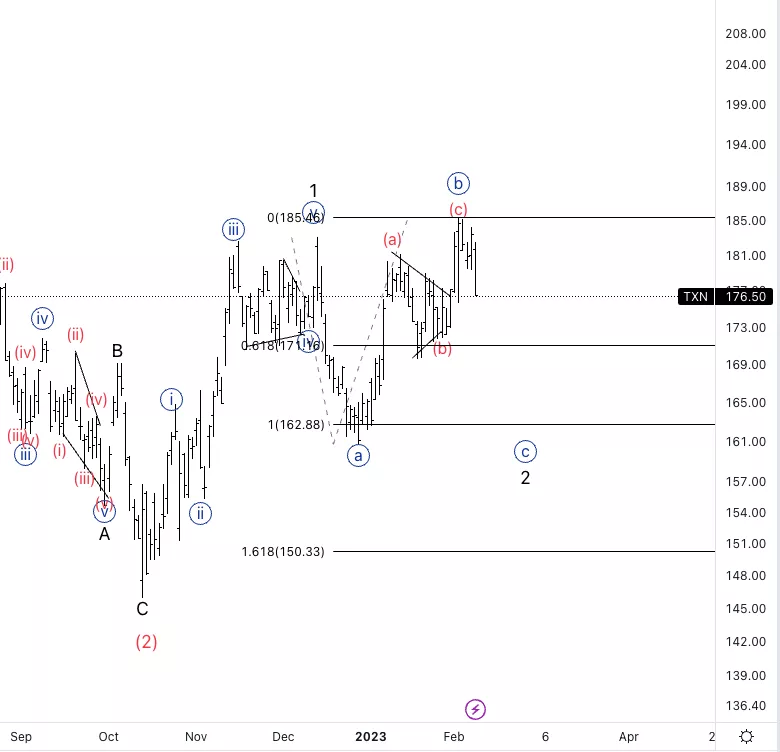
Texas Instruments Inc., (Nasdaq: TXN): Daily Chart, 9 February 2023.
TXN Stock Market Analysis: Moving as expected from the previous update. We are looking for further downside into wave {c} of 2 as the move up that broke the top of wave 1 was a clear three-wave move and therefore could not be impulsive.
TXN Elliott Wave Count: Wave {c} of 2.
TXN Technical Indicators: broke below the 20EMA.
TXN Trading Strategy: Looking for a break of wave (b) before considering shorts.
Analyst: Alessio Barretta
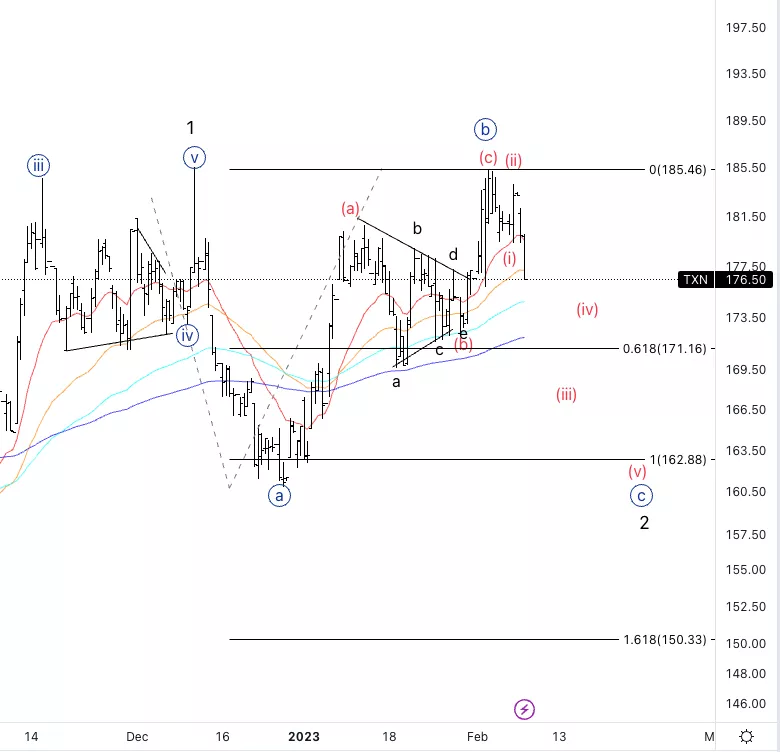
Texas Instruments Inc., TXN: 4-hour Chart, 9 February 2023.
Texas Instruments Inc., Elliott Wave Technical Analysis
TXN Stock Market Analysis: It looks like we are in wave (iii) already as we are breaking through the moving averages.
TXN Elliott Wave count: Wave (iii) of {c}.
TXN Technical Indicators: RSI momentum is lower than it was in wave (b).
TXN Trading Strategy: Looking for at least a pullback in wave (iv) to consider shorts.
More By This Author:
US Stocks Displaying Weakness At Current Highs
Elliott Wave Technical Analysis: Intuitive Surgical Inc., Wednesday, Feb. 8
Uniswap / U.S. Dollar (UNIUSD) Elliott Wave Technical Analysis


Comments
Log in or sign up to join the conversation.