
Intuitive Surgical Inc., Elliott Wave Technical Analysis

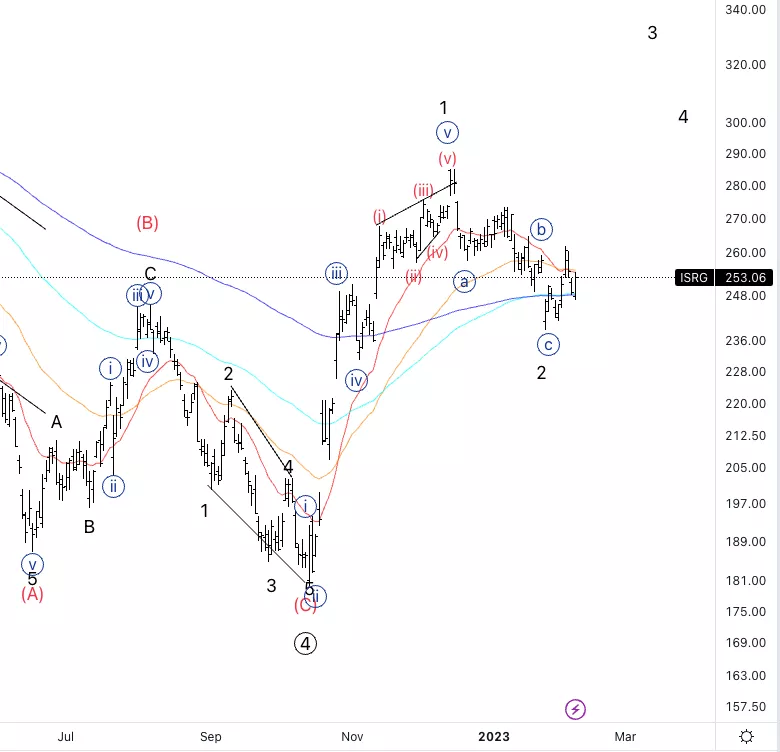
Intuitive Surgical Inc., (ISRG): Daily Chart, February 8, 2023
ISRG Stock Market Analysis: Looking for further upside in wave {i} of 3, however we are still on for a double correction lower into wave {c} of 2.
ISRG Elliott Wave Count: Wave (i) of {i}.
ISRG Technical Indicators:200EMA as support, 20 and 50EMAs crossing.
ISRG Trading Strategy: Looking for a break of wave {b} before considering longs.
TradingLounge Analyst: Alessio Barretta
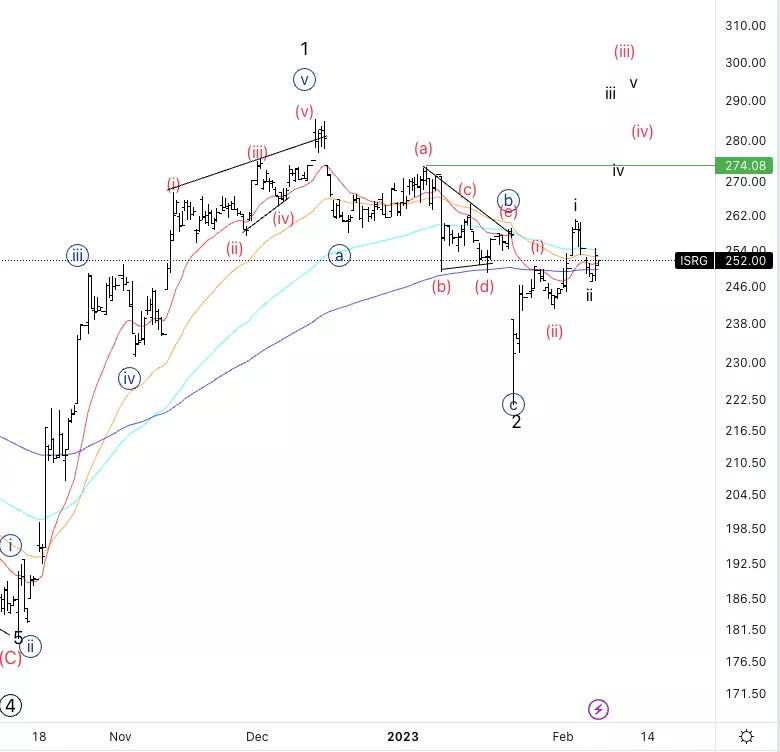
Intuitive Surgical Inc., ISRG: 4-hour Chart, February 8, 2023
Intuitive Surgical Inc., Elliott Wave Technical Analysis
ISRG Stock Market Analysis: It looks like we could either have a nest into wave {i} with a (i),(ii) and then again i,ii or else we could be making a flat wave (ii).
ISRG Elliott Wave count: Wave (i) of {i}.
ISRG Technical Indicators: Crossing of the 20 and 200EMA.
ISRG Trading Strategy: Looking for evidence we have resumed the uptrend with a clear trend establishing move off the lows.
More By This Author:
Uniswap / U.S. Dollar (UNIUSD) Elliott Wave Technical Analysis
Elliott Wave Technical Analysis: Adobe Inc.
Elliott Wave Technical Analysis: Bitcoin / U.S. Dollar


Comments
Log in or sign up to join the conversation.