

Image Source: Unsplash
Spotify Technology S.A., Elliott Wave Technical Analysis
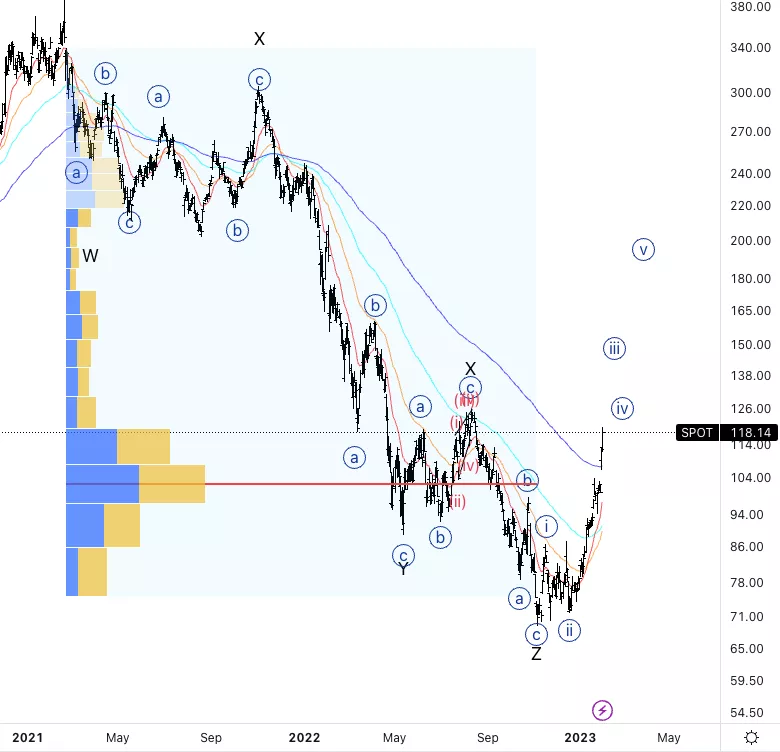
Spotify Technology S.A., (NYSE: SPOT): Daily Chart, 2 February 2023.
SPOT Stock Market Analysis: Looking for an impulsive move off the lows as we are seeing a steep climb that broke through the 200EMA and the volume-based point of control
SPOT Elliott Wave Count: Wave {iii} of 1.
SPOT Technical Indicators: Above all averages.
SPOT Trading Strategy: Looking for wave {iv} to enter long.
Analyst: Alessio Barretta
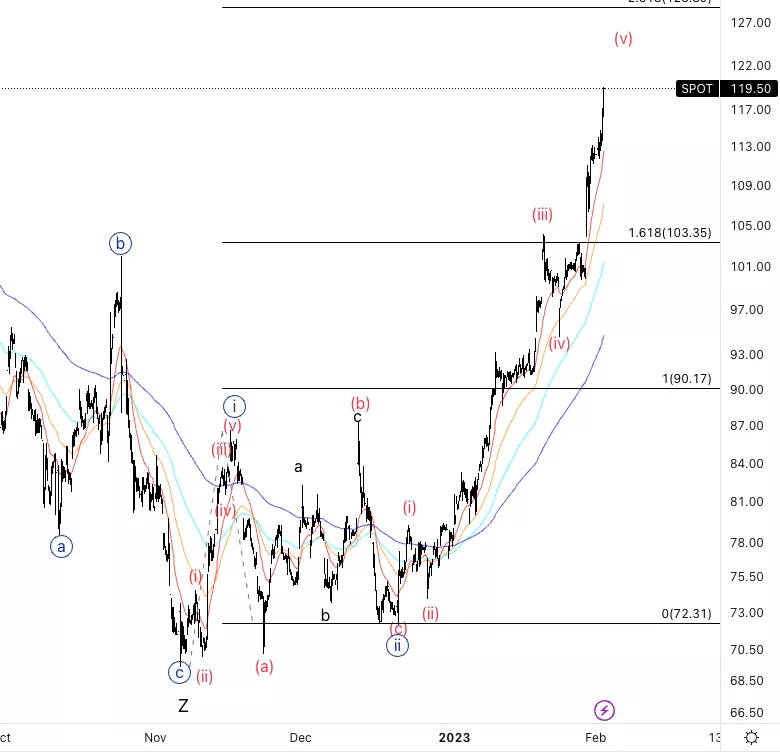
Spotify Technology S.A., SPOT: 1-hour Chart, 2 February 2023.
Spotify Technology S.A., Elliott Wave Technical Analysis
SPOT Stock Market Analysis: We can count five waves off the lows in wave {i} as well as five waves into wave {iii}. We could be near the end of (v), 2.618% {iii} vs. {i} could be the next resistance.
SPOT Elliott Wave count: Wave (v) of {iii}.
SPOT Technical Indicators: RSI is in overbought territory as well above the averages.
SPOT Trading Strategy: Looking for wave {iv} before placing longs.
More By This Author:
The Stock Market Continues To Move Higher As Expected
Elliott Wave Technical Analysis: CSX Corp. - Wednesday, Fed. 1
Elliott Wave Technical Analysis: Ethereum / U.S. Dollar


Comments
Log in or sign up to join the conversation.