

Image Source: Pixabay
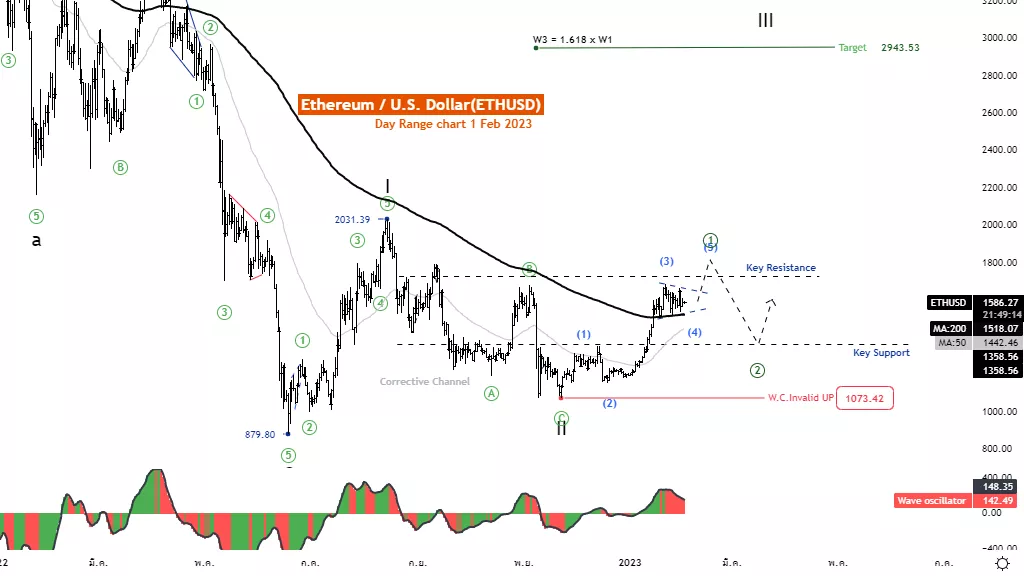
Elliott Wave Analysis TradingLounge Daily Chart, 1 Febuary 2023
Ethereum / U.S. Dollar (ETHUSD)
ETHUSD Elliott Wave Technical Analysis
Function: Follow trend
Mode: Motive
Structure: Impulse
Position: Wave III
Direction Next higher Degrees: wave III of Motive
Wave Cancel invalid Level: 1073
Ethereum / U.S. Dollar (ETHUSD) Trading Strategy: Ethereum recovered well from the 1073 level and could break the MA200 as a signal of weakening of the downtrend. As a result, the trend may change to an uptrend. And there is a tendency towards to the price target at 2943.
Ethereum / U.S. Dollar (ETHUSD) Technical Indicators: The price is above the MA200 MA50, indicating an uptrend. The wave oscillators above Zero-Line momentum are bullish.
Analyst: Kittiampon Somboonsod
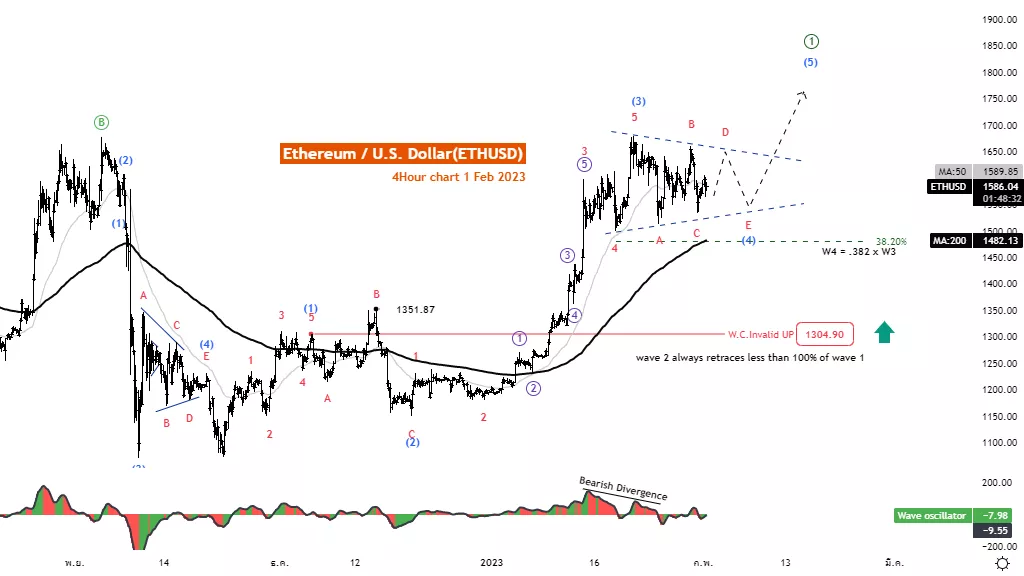
Elliott Wave Analysis TradingLounge 4H Chart, 1 Febuary 2023
Ethereum / U.S. Dollar (ETHUSD)
ETHUSD Elliott Wave Technical Analysis
Function: Follow trend
Mode: Motive
Structure: Impulse
Position: Wave (3)
Direction Next higher Degrees: wave ((1)) of Motive
Wave Cancel invalid Level: 1231
Ethereum / U.S. Dollar (ETHUSD) Trading Strategy: Ethereum continues to strengthen in its current impulse wave pattern. It is in the phase of a correction in wave (4), upon its completion, the price will increase in wave ((5)) again.
Ethereum / U.S. Dollar (ETHUSD) Technical Indicators: The price is above the MA200, indicating an uptrend. The wave oscillators have Bearish divergence watch out for Reversal.
More By This Author:
Elliott Wave Technical Analysis: Block Inc.
Elliott Wave Technical Analysis: Bitcoin / U.S. Dollar, Jan. 31
S&P 500 Index Analysis And Forecast


Comments
Log in or sign up to join the conversation.