
Elliott Wave Technical Analysis S&P 500
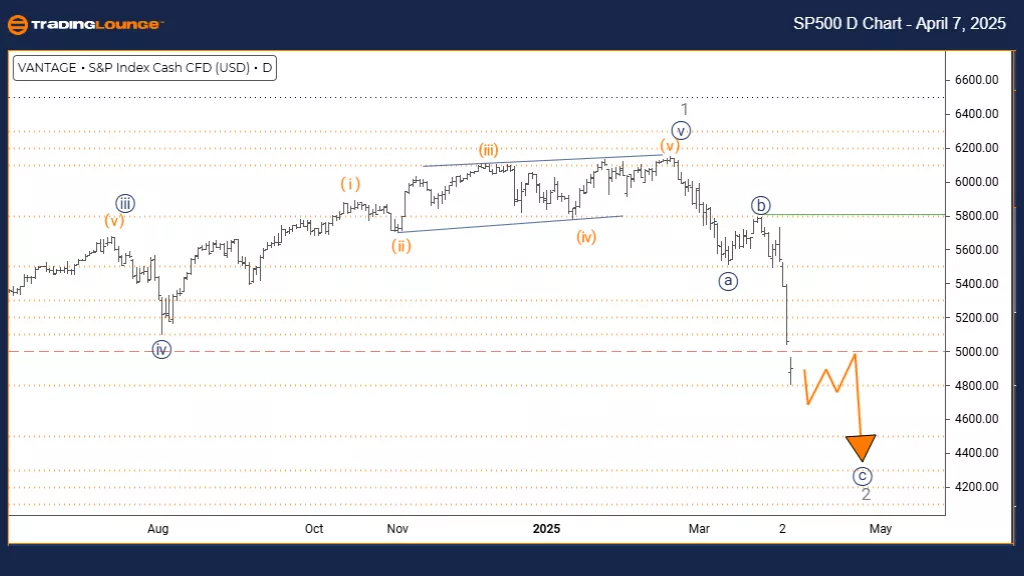
S&P 500 Elliott Wave Analysis – Daily Chart
Index: S&P 500 (SPX)
Chart Type: Daily Chart
Technical Overview
- Function: Counter-Trend
- Mode: Impulsive as Wave C
- Wave Structure: Navy Blue Wave C
- Current Position: Gray Wave 2
- Next Higher Degree: Gray Wave 3
S&P 500 Elliott Wave Summary – Daily Perspective:
The S&P 500 is currently positioned in a counter-trend structure, moving through navy blue wave C, which is part of the larger gray wave 2. The preceding navy blue wave B appears to have ended, paving the way for this current impulsive phase within a broader corrective sequence.
As part of the ongoing correction, the wave C movement is anticipated to unfold in an impulsive form. This behavior is typical in the final leg of a correction and may help define the structure's completion before transitioning into gray wave 3.
Analytical Insights:
- Wave C movements frequently appear as five-wave impulsive patterns and often complete complex corrections.
- Traders should remain alert for signals of structure completion to time potential re-entries or exits.
- Understanding the current wave's role within the broader count enhances both tactical and strategic decision-making.
Trading Implications:
This chart setup offers important insights for investors managing near-term market volatility. As the index continues through this corrective stage, both short-term trades and longer-term strategies should consider the broader wave relationships. Awareness of key structural milestones is essential for navigating price action confidently.
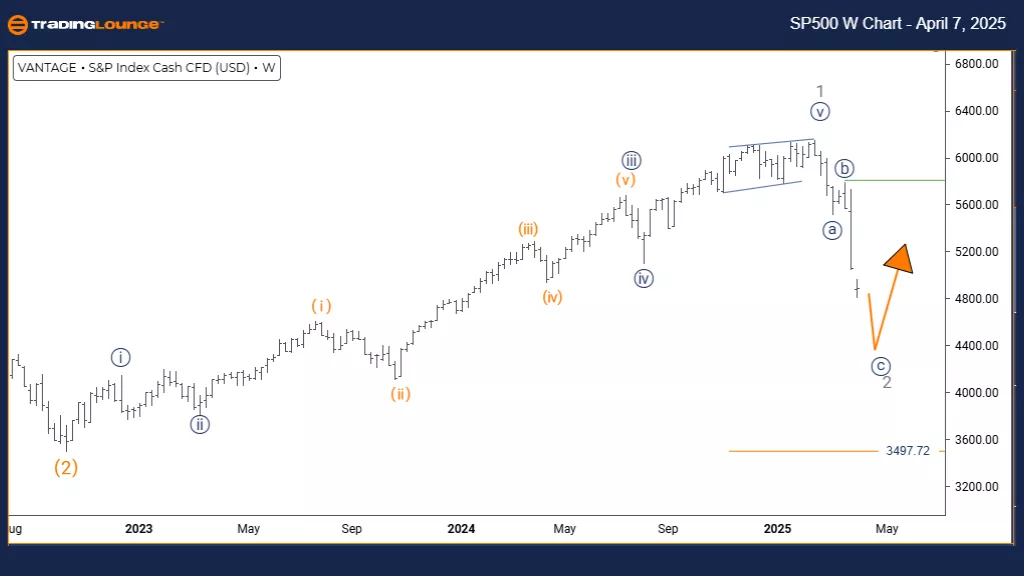
S&P 500 Elliott Wave Analysis – Weekly Chart
Index: S&P 500 (SPX)
Chart Type: Weekly Chart
Technical Overview
- Function: Counter-Trend
- Mode: Corrective
- Wave Structure: Navy Blue Wave C
- Current Position: Gray Wave 2
- Next Higher Degree: Gray Wave 3
- Invalidation Level: 3497.72
S&P 500 Elliott Wave Summary – Weekly Perspective:
The S&P 500 is currently engaged in a corrective counter-trend phase, progressing through navy blue wave C, which is part of the broader gray wave 2 structure. The earlier navy blue wave B correction is now considered complete, signaling the beginning of wave C’s development within this higher-degree framework.
This wave C movement is expected to follow a corrective structure, often characterized by three-wave formations or sideways consolidation. The key invalidation point for the current analysis is set at 3497.72—a breach of which would nullify the existing wave count.
Analytical Insights:
-
Navy blue wave C plays a pivotal role in shaping intermediate market behavior and positioning within gray wave 2.
-
Investors should stay alert for signals marking the end of this corrective leg before considering positions aligned with gray wave 3's expected direction.
-
The weekly time frame allows for a broader view, supporting both short-term assessments and strategic long-term positioning.
Trading Implications:
This setup supports a measured approach for position traders and long-term investors, as the index completes a transitional phase within its larger cycle. Monitoring wave characteristics is key to validating the unfolding structure and preparing for the potential transition into gray wave 3.
Technical Analyst: Malik Awais
More By This Author:
Elliott Wave Technical Analysis: U.S. Dollar/Japanese Yen - Monday, April 7
Elliott Wave Technical Analysis: Bitcoin Crypto Price - Monday, April 7
Elliott Wave Technical Forecast: News Corporation - Friday, April 4
At TradingLounge™, we provide actionable Elliott Wave analysis across over 200 markets. Access live chat rooms, advanced AI & algorithmic charting tools, and curated trade ...
more

