
RUSSELL 2000 Elliott Wave Analysis | Trading Lounge Day Chart
RUSSELL 2000 Elliott Wave Technical Analysis
Function: Bullish Trend
Mode: Impulsive
Structure: Orange Wave 1
Position: Navy Blue Wave 1
Direction Next Lower Degrees: Orange Wave 2
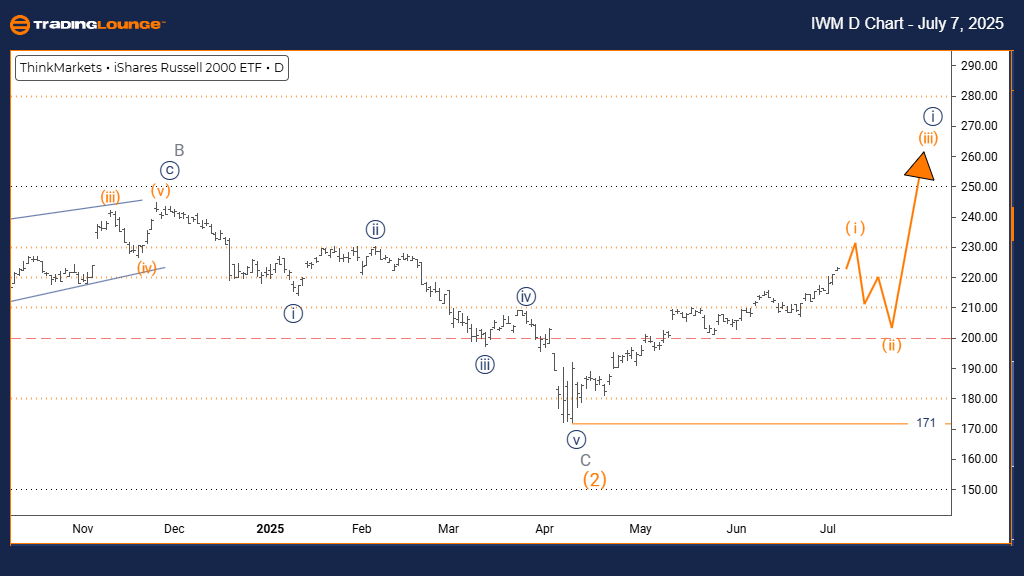
Details: Orange Wave 1 of Navy Blue Wave 1 is currently forming in a new uptrend.
Wave Cancel Invalidation Level: 171
The Russell 2000 index on the daily chart is currently showing a bullish trend, based on Elliott Wave analysis. The impulsive market behavior indicates strong upward momentum, suggesting the early stages of a new rising cycle. The wave structure currently developing is Orange Wave 1, nested within Navy Blue Wave 1, pointing to the start of a potentially extended uptrend.
Orange Wave 1 is unfolding, laying the groundwork for what could become a sustained bullish run. The expected next step in the sequence is Orange Wave 2, typically a corrective movement that may provide potential buying opportunities before the upward momentum resumes.
An important invalidation level is marked at 171. A decline to this point would invalidate the present wave count and necessitate a full reassessment of the market outlook. Traders should use this level as a risk control reference.
The existing technical outlook suggests favorable conditions for bullish positions. Market participants can look for confirmation signals and identify suitable entry levels while keeping an eye on the invalidation point as the wave sequence continues to evolve.
RUSSELL 2000 Elliott Wave Analysis | Trading Lounge Weekly Chart
RUSSELL 2000 Elliott Wave Technical Analysis
Function: Bullish Trend
Mode: Impulsive
Structure: Navy Blue Wave 1
Position: Gray Wave 1
Direction Next Lower Degrees: Navy Blue Wave 2
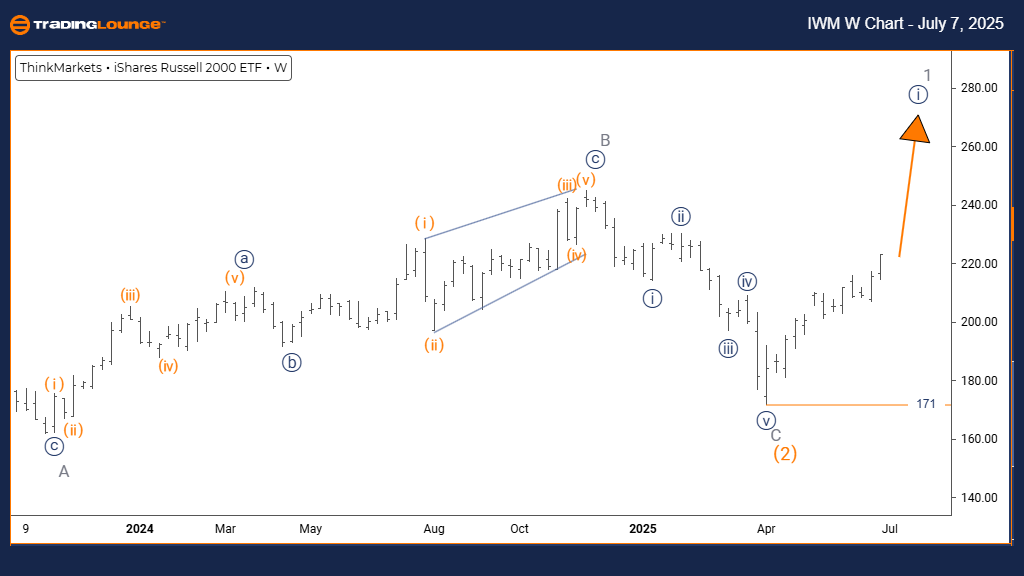
Details: Orange Wave 2 appears completed; Navy Blue Wave 1 of 1 is currently forming.
Wave Cancel Invalidation Level: 171
The Russell 2000 index on the weekly chart is also reflecting strong bullish momentum based on Elliott Wave principles. The market is in impulsive mode, with Navy Blue Wave 1 developing within the broader Gray Wave 1 formation. This configuration signals the beginning of a potential long-term upward trend.
The completion of Orange Wave 2 marks the transition into Navy Blue Wave 1, which is now actively in motion. This represents the first leg of a larger bullish cycle and is expected to continue until the next corrective phase—Navy Blue Wave 2—emerges.
The wave invalidation point is set at 171. A drop to this level would call into question the existing wave interpretation and would require a new market analysis. Traders should consider this level crucial for strategy alignment and risk management.
Overall, the setup points to favorable conditions for long-term bullish positions. As the broader wave progresses, investors and traders can seek confirmation setups and strategic entry points, while remaining alert to the invalidation threshold.
Technical Analyst: Malik Awais
More By This Author:
Elliott Wave Technical Forecast: Newmont Corporation - Friday, July 4
Elliott Wave Technical Analysis Riot Platforms, Inc.
Elliott Wave Technical Analysis: New Zealand Dollar/U.S. Dollar - Friday, July 4


Comments
Log in or sign up to join the conversation.