

Image Source: Unsplash
PayPal Holding Ltd., Elliott Wave Technical Analysis
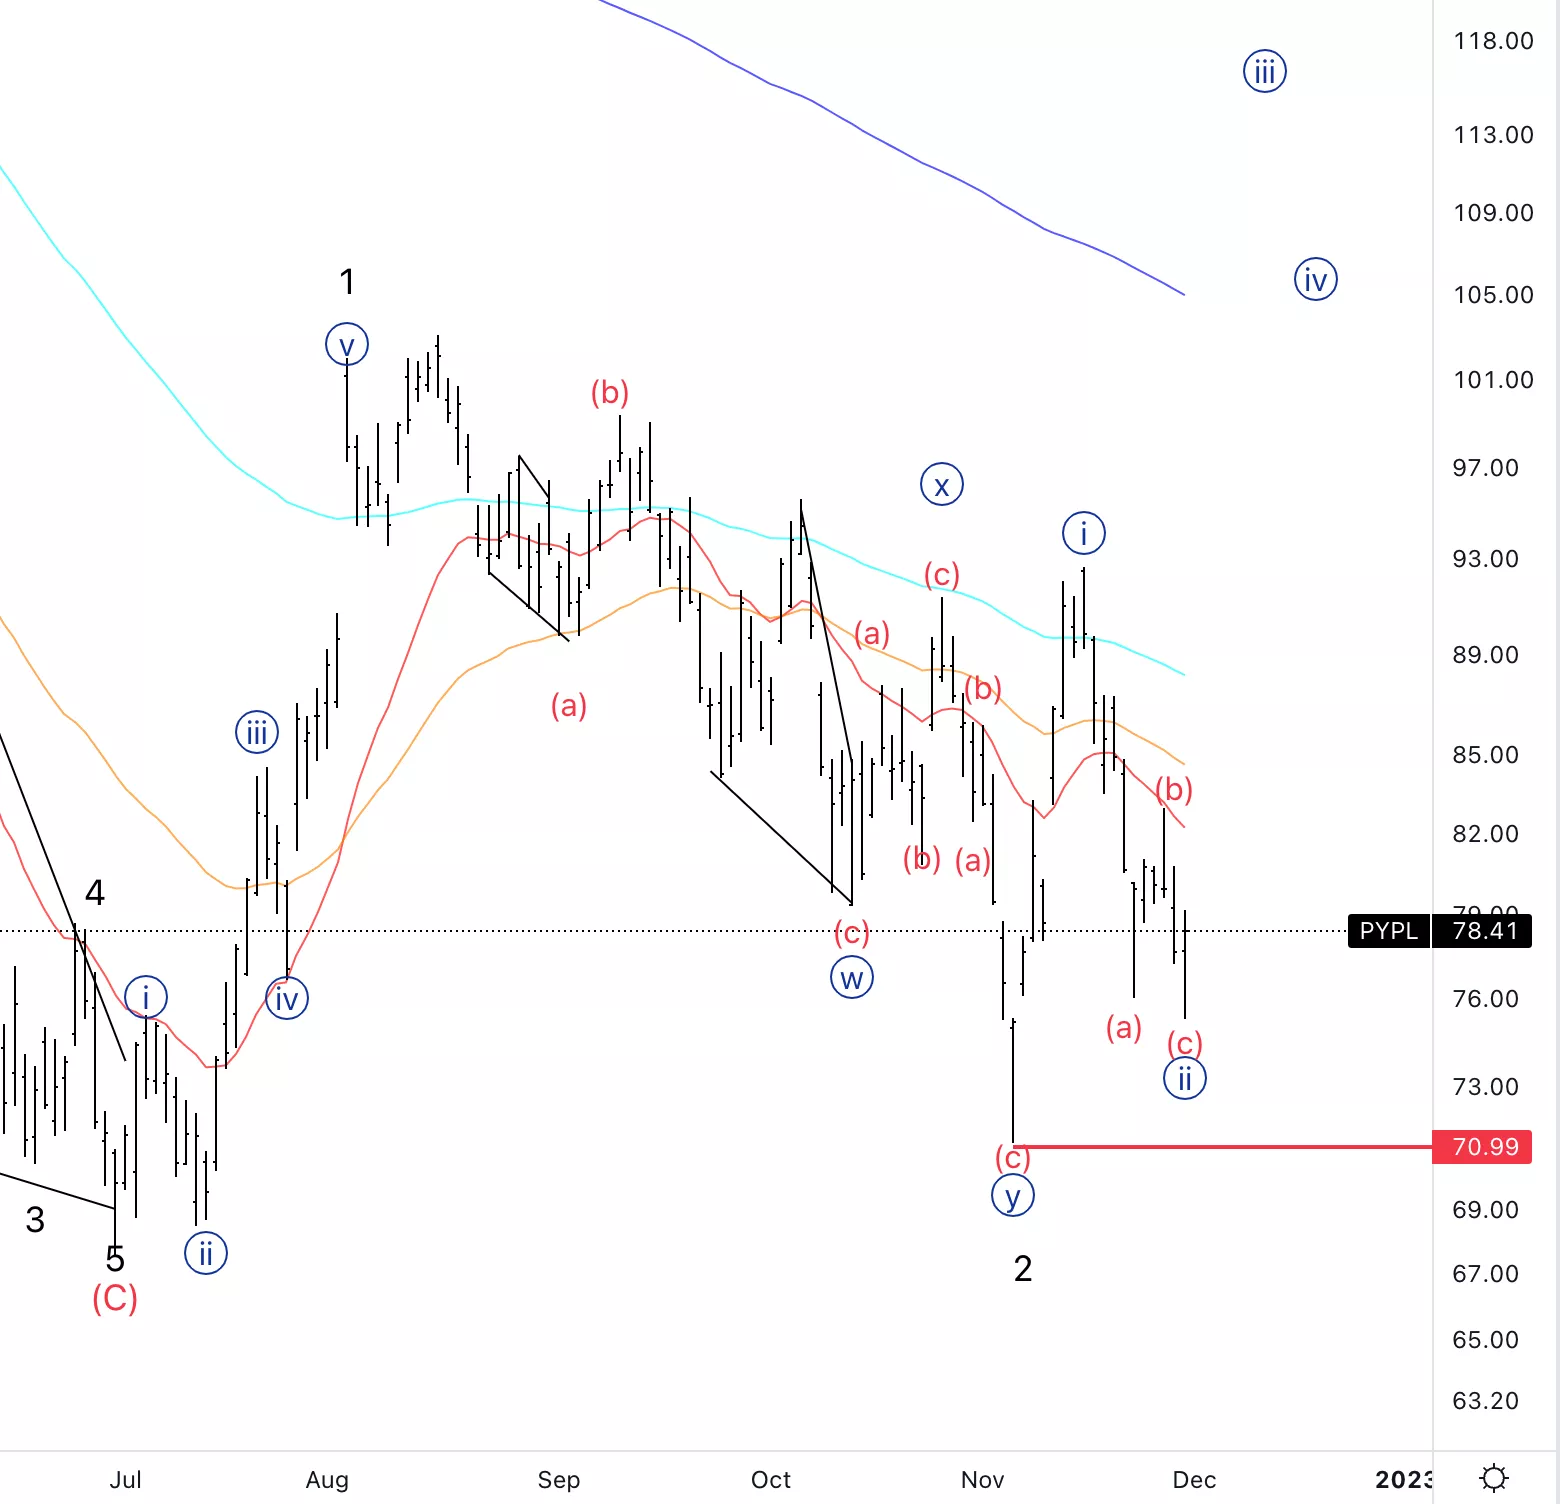
PayPal Holding Ltd., (Nasdaq: PYPL): Daily Chart, December 12022,
PYPL Stock Market Analysis: We have had an additional move lower which we weren’t anticipating, however, the overall count stays intact as there has been no massive wave count invalidation.
PYPL Elliott Wave Count: Wave {ii} of 3.
PYPL Technical Indicators: Below all EMAs.
PYPL Trading Strategy: Looking for further upside into wave {iii} with an aggressive trade which could guarantee a high return given the high risk with a stop below $71.
Analyst: Alessio Barretta
(Click on image to enlarge)
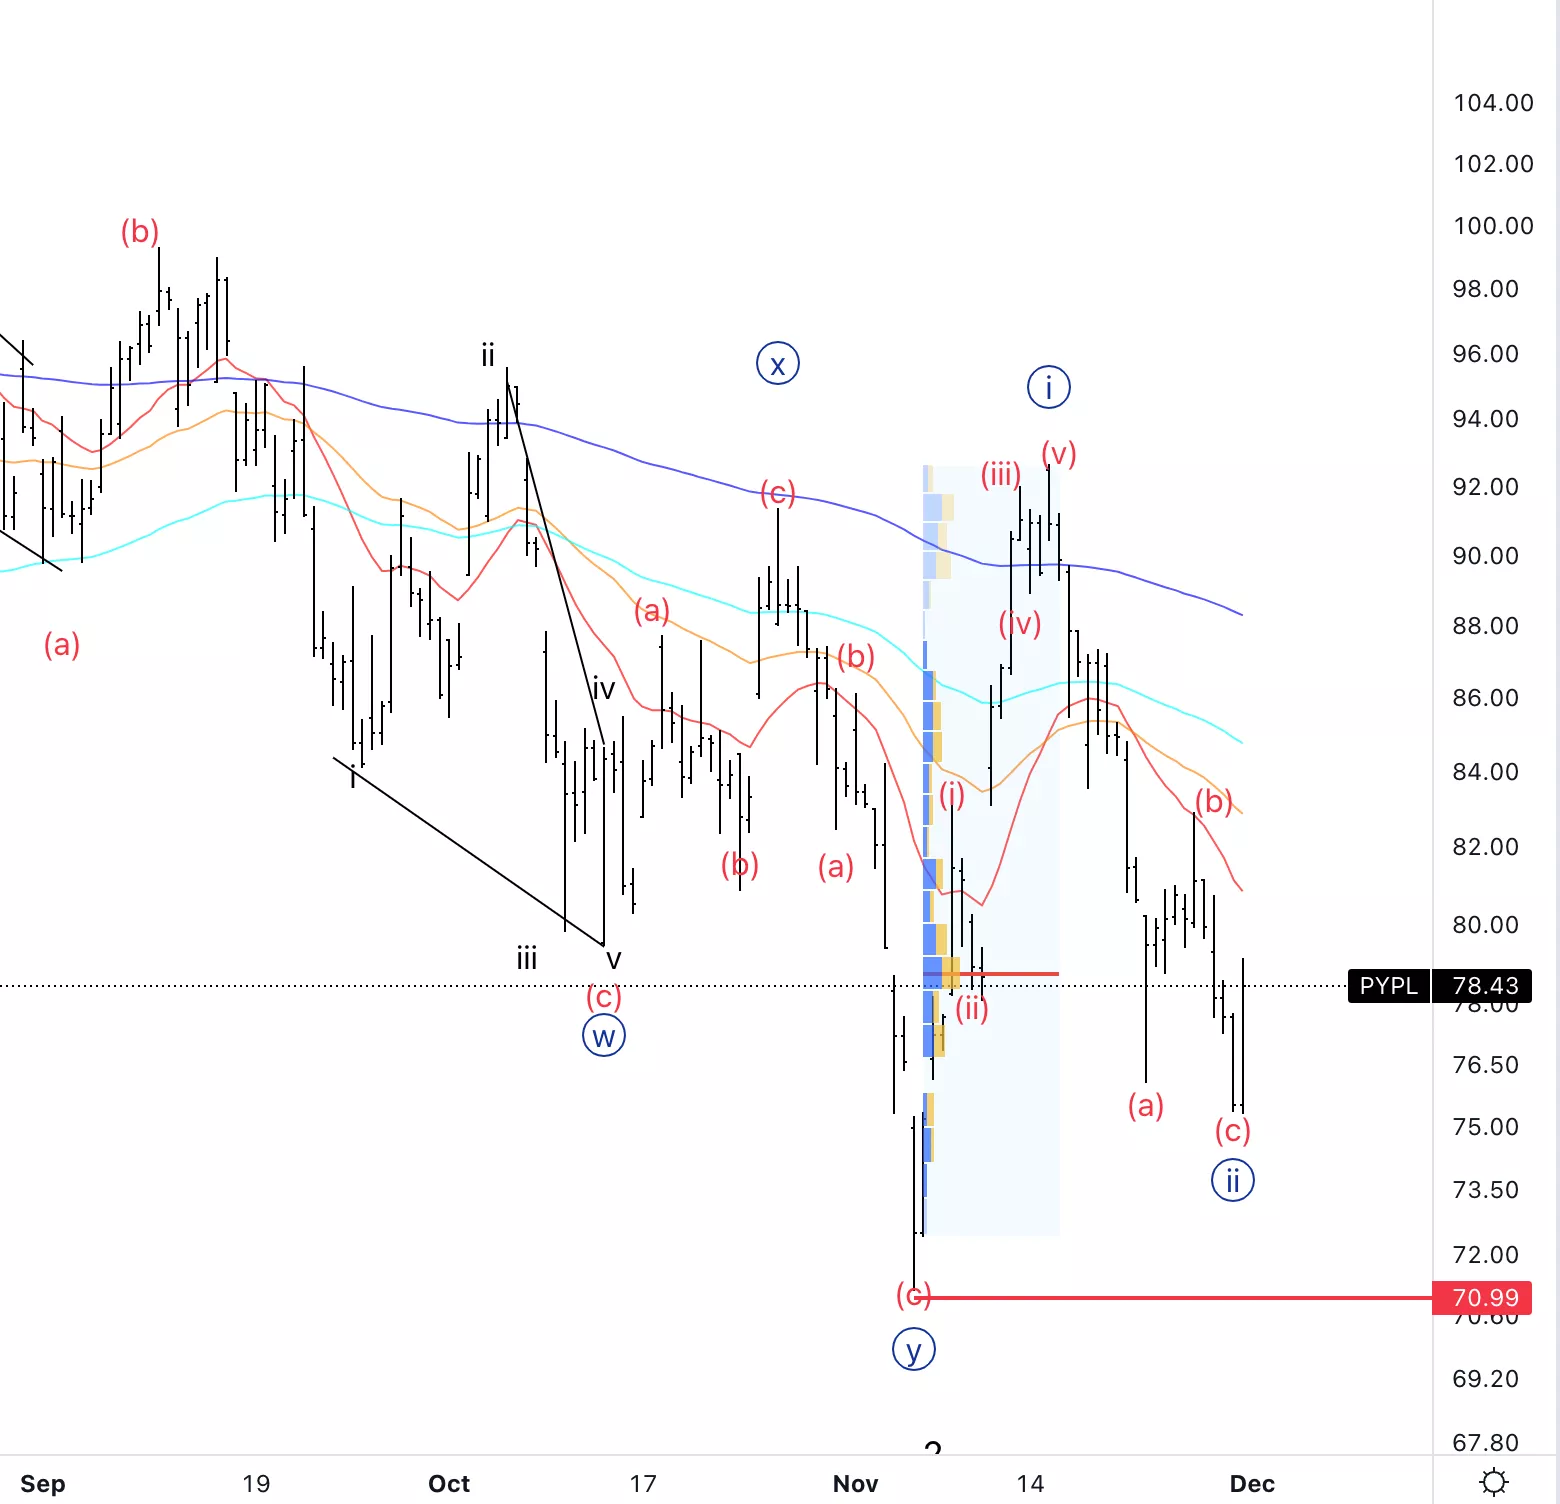
PayPal Holding Ltd., PYPL: 4-hour Chart, December 1, 2022
PayPal Holding Ltd., Elliott Wave Technical Analysis
PYPL Stock Market Analysis: It looks like there is a possibility the correction is completed as we also reacted higher from a high volume level.
PYPL Elliott Wave count: Wave {ii} of 3.
PYPL Technical Indicators: Below all EMAs.
PYPL Trading Strategy: Similar strategy to the daily chart, it is worth mentioning that going long now carries a higher risk as there is no strong evidence in favor of the fact the correction in wave{ii} is finished.
More By This Author:
SP500 Elliott Wave Technical Analysis
Elliott Wave: Commodity Markets - Wednesday, Nov. 30
Elliott Wave Technical Analysis: Cisco Systems, Wednesday, Nov. 30


Comments
Log in or sign up to join the conversation.