
Cisco Systems Inc., Elliott Wave Technical Analysis

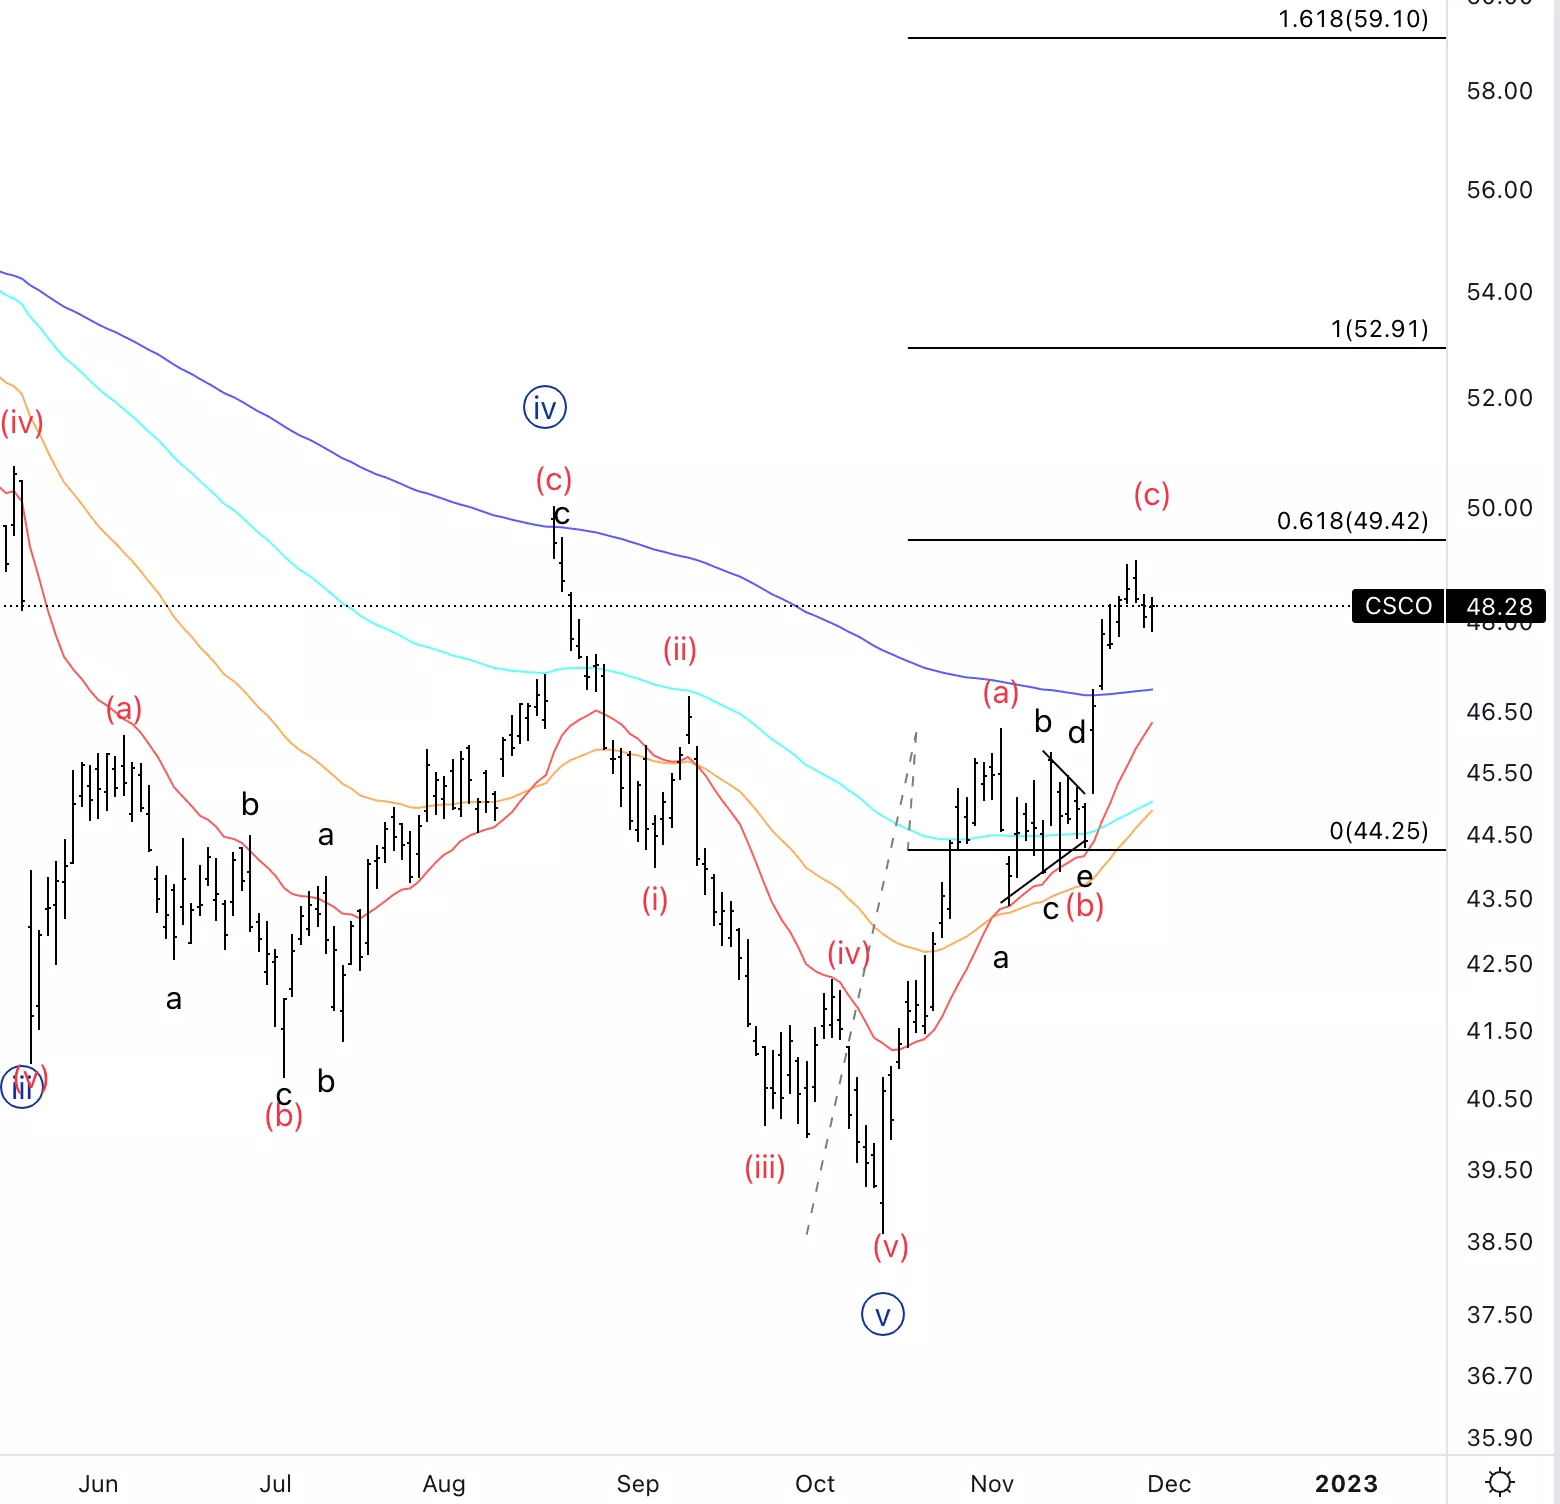
Cisco Systems Inc., (CSCO): Daily Chart, November 30 2022,
CSCO Stock Market Analysis: Cisco has been moving higher as expected after the triangle in wave (b). At this point we are closely tracking down the relationship between wave (c) and (a) looking for resistance to step in.
CSCO Elliott Wave Count: Wave (c) of {a}.
CSCO Technical Indicators: Above all EMAs.
CSCO Trading Strategy: Looking for further upside to at least reach 0.618 (c) vs. (a) unless we topped at 49.05 and are already moving lower.
TradingLounge Analyst: Alessio Barretta
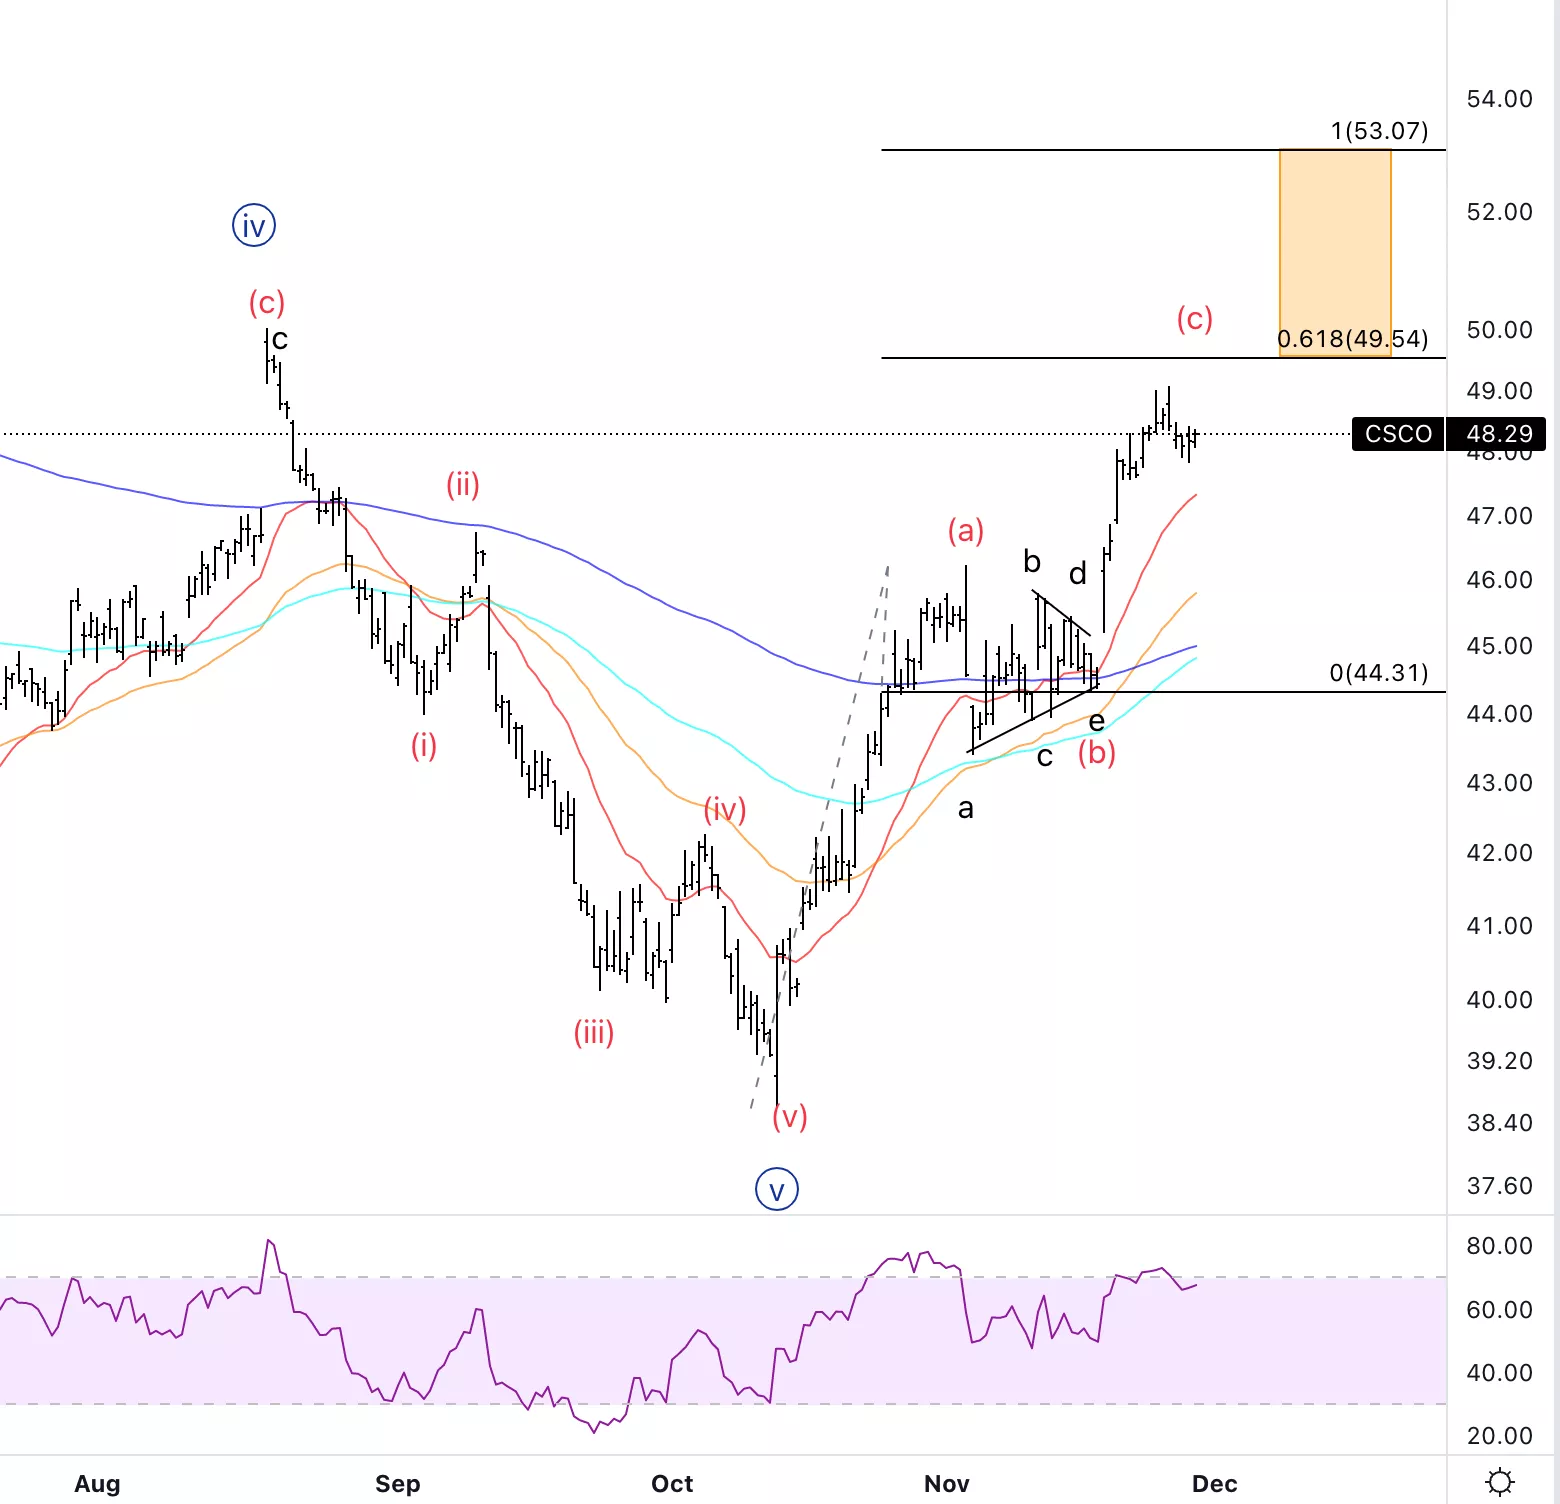
Cisco Systems Inc.: 4-hour Chart, November 30 2022
Cisco Systems Inc., Elliott Wave Technical Analysis
CSCO Stock Market Analysis: The yellow area is the zone where I would be expecting resistance with a high level of conviction. On even lower timeframes I struggle to count the move down off the 49.05$ top as impulsive therefore I am expecting further upside.
CSCO Elliott Wave count: Wave ii of (c).
CSCO Technical Indicators: Above all averages with RSI divergence between the top of wave (a) and the current 49$ top.
CSCO Trading Strategy: Looking for shorts once we get a clear signal the up move is complete.
More By This Author:
Australian Stock Report, Wednesday, Nov. 30
European Stock Market Views
Elliott Wave Technical Analysis: Monero - Wednesday, Nov. 30


Comments
Log in or sign up to join the conversation.