

Photo by Mika Baumeister on Unsplash
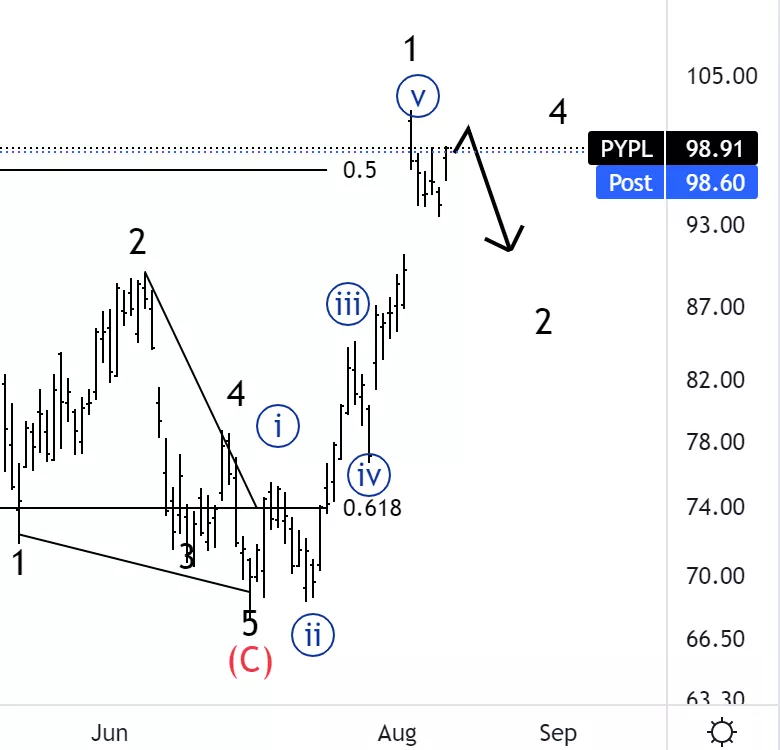
PayPal Holdings Inc., (Nasdaq: PYPL): Daily Chart, August 11, 2022,
PYPL Stock Market Analysis: We are looking at a pullback that is following a five-wave move to the upside, therefore we do expect further upside to come once this pullback is completed.
PYPL Elliott Wave count: Wave 2
PYPL Trading Strategy: wait to have further confirmation on how this wave 2 will develop and then look for longs.
PYPL Technical Indicators: We are still below the 200 EMA, however, momentum indicators suggest we are into the massively bought territory.
PYPL Latest News: 10 Popular Alternatives to PayPal(Yahoo Finance).
TradingLounge Analyst: Alessio Barretta
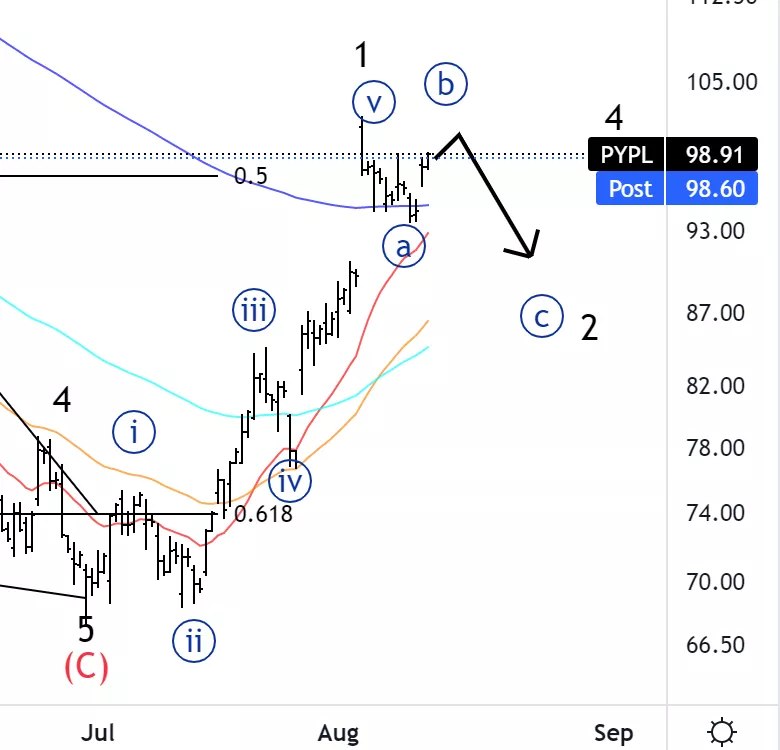
PayPal Holdings Inc., PYPL: 4-hour Chart, August 11, 2022,
PayPal Holdings Inc., Elliott Wave Technical Analysis
PYPL Stock Market Analysis: Looking for a potential continuation lower into wave {c} to complete the correction.
PYPL Elliott Wave count: Wave a of {c} of 2.
PYPL Technical Indicators: We just bounced off the 200EMA acting as support which could indicate a very small wave 2 completed already.
PYPL Trading Strategy: Looking for confirmation of trend resumption.
More By This Author:
Elliott Wave Trading Strategies: Dollar Index DXY, DAX 40, FTSE 100, STOXX 50, EURUSD
S&P500 Elliott Wave Analysis: Wave (i) Of V) Of C Of (A)
Elliott Wave Analysis: Netflix


Comments
Log in or sign up to join the conversation.