

Image Source: Unsplash
Netflix Inc., Elliott Wave Technical Analysis
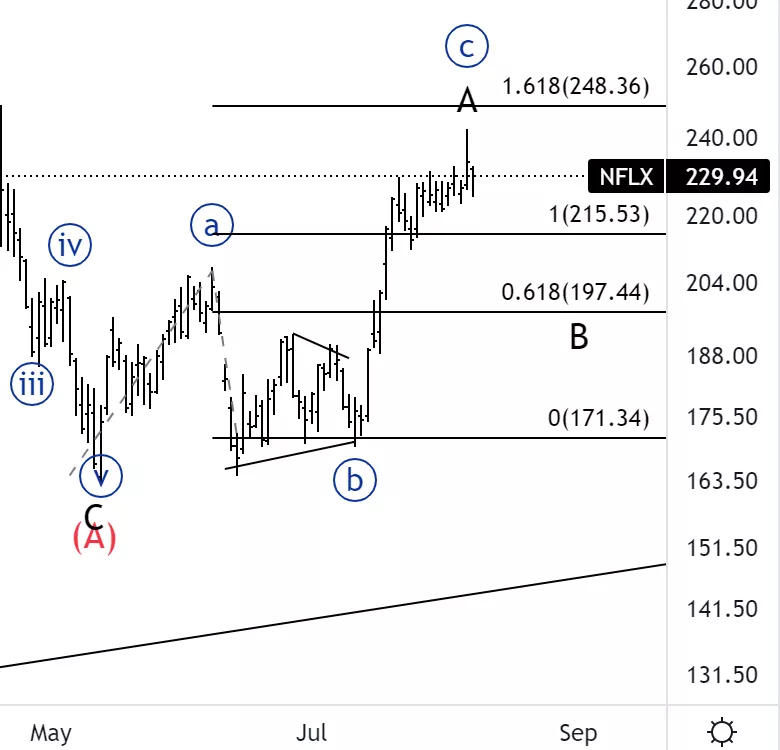
Netflix Inc., (Nasdaq: NFLX): Daily Chart, August 10, 2022,
NFLX Stock Market Analysis: Looking for a potential ending diagonal in wave {c} of A to be near completion. Ideally, we want to see a strong move lower in the following days to confirm the analysis.
NFLX Elliott Wave count: Wave {c} of A.
NFLXTrading Strategy: wait for the initial move down in wave {a} of B to then look for additional downside.
NFLXTechnical Indicators: We are well below the 200 EMA as well as we are forming bearish divergence on the RSI.
Analyst: Alessio Barretta
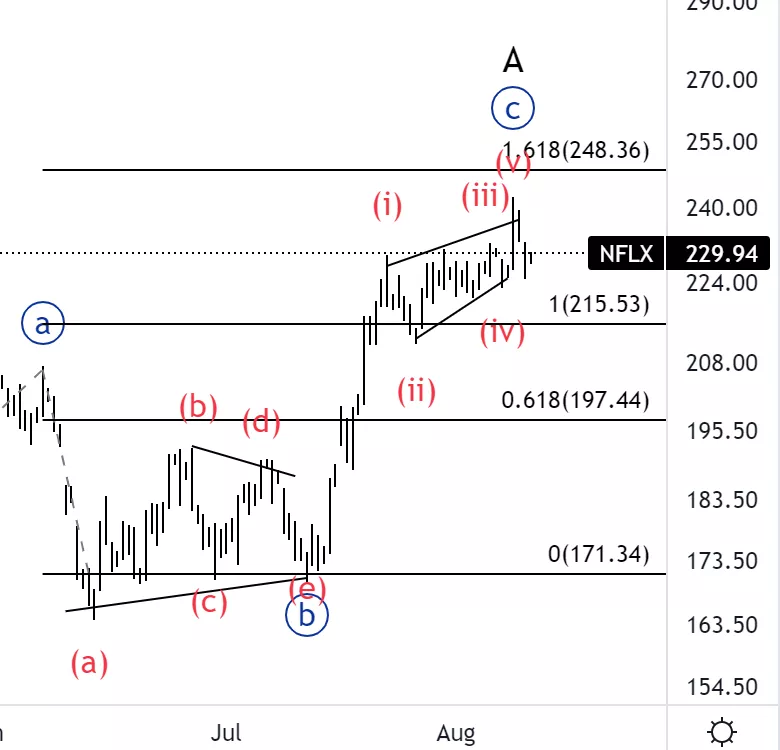
Netflix Inc. NFLX: 4-hour Chart, August 102022,
Netflix Inc., Elliott Wave Technical Analysis
NFLX Stock Market Analysis: Looking for downside to come soon, we would like to see the 220$ being broken as that would provide additional confirmation.
NFLXElliott Wave count: Wave {c} of A.
NFLX Technical Indicators: We are close to the 200 EMA but still below. That could act as resistance and drive prices lower.
NFLXTrading Strategy: Looking for a break of the 220$ is to have additional confirmation.
More By This Author:
ASX 200 Elliott Wave Analysis
UNIUSD Elliott Wave Analysis
U.S. Stocks. Elliott Wave Analysis


Comments
Log in or sign up to join the conversation.