
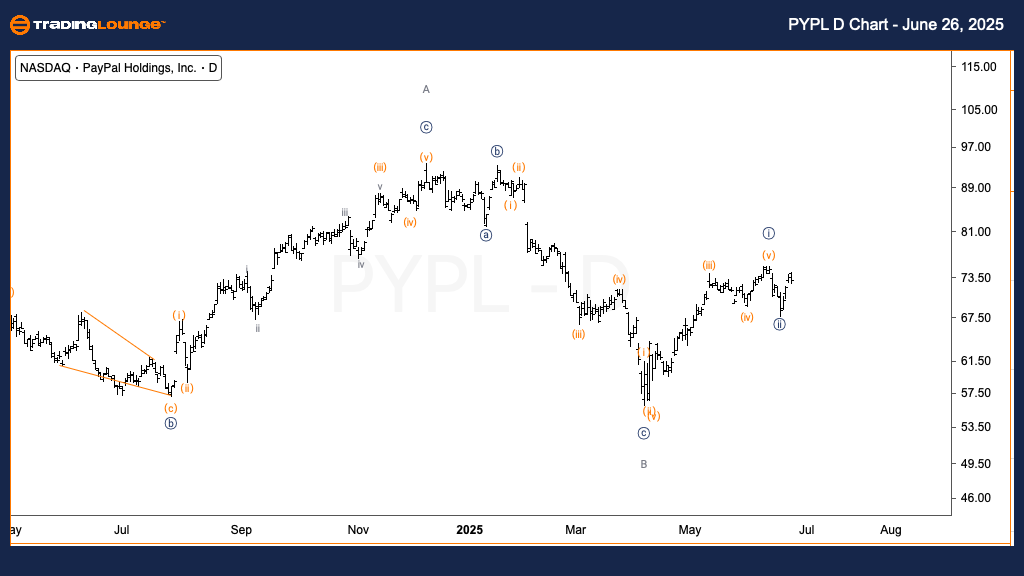
PayPal Holdings Inc. (PYPL) Elliott Wave Analysis – Trading Lounge Daily Chart
Function: Trend
Mode: Impulsive
Structure: Motive
Position: Wave C of (B)
Direction: Upside in Wave C
Details: Current price action suggests continued movement upward in Wave C, as pullbacks occur in clear three-wave formations. This pattern typically aligns with corrective phases and not full reversals, indicating a potentially bullish phase in play.
PayPal Holdings Inc. (PYPL) Elliott Wave Analysis – Trading Lounge 1-Hour Chart
Function: Trend
Mode: Impulsive
Structure: Motive
Position: Wave {iii} of C
Direction: Upside in Wave {iii}
Details: The intraday chart indicates a likely completion of Wave {ii}, with price now advancing in Wave {iii}. An alternative scenario considers the move as part of Wave (v) of {i}, hinting at a potential short consolidation before the bullish trend resumes. Further upside confirmation depends on near-term resistance tests and momentum strength.
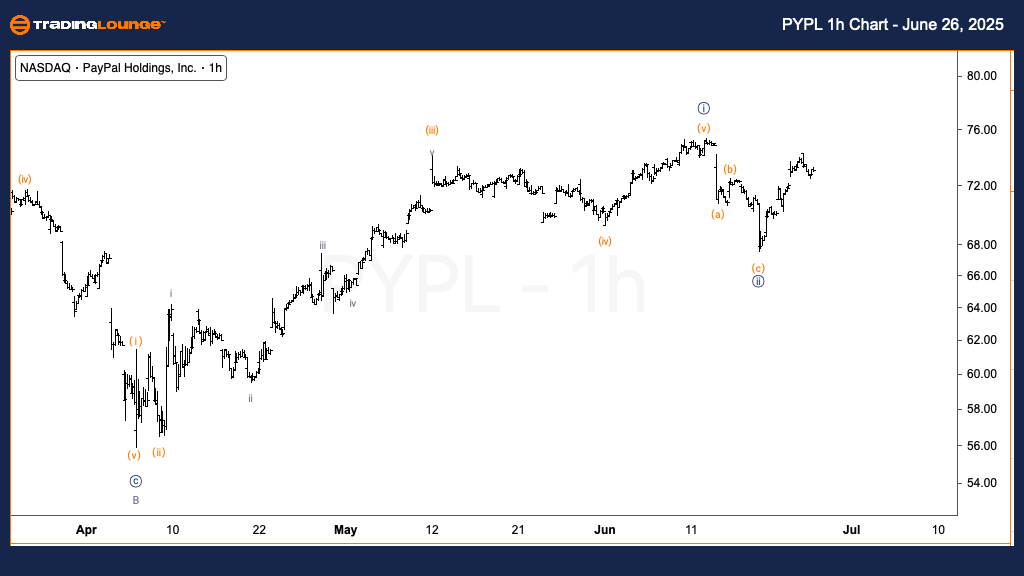
This Elliott Wave analysis of PayPal Holdings Inc. (PYPL) combines both daily and hourly timeframes to provide a clearer picture of current market structure. On the daily chart, PYPL is viewed within a corrective Wave (B), progressing through Wave C, which remains bullish for now. Meanwhile, the 1-hour chart refines this view by placing the stock in the accelerating Wave {iii} of C, or possibly in Wave (v) of a smaller wave sequence.
Technical Analyst: Alessio Barretta
More By This Author:
Unlocking ASX Trading Success: Coles Group Limited - Thursday, June 26
Elliott Wave Technical Analysis: Euro/U.S. Dollar - Thursday, June 26
Elliott Wave Technical Analysis: Chainlink Crypto Price News For Thursday, June 26


Comments
Log in or sign up to join the conversation.