
PayPal Holdings Inc., Elliott Wave Technical Analysis

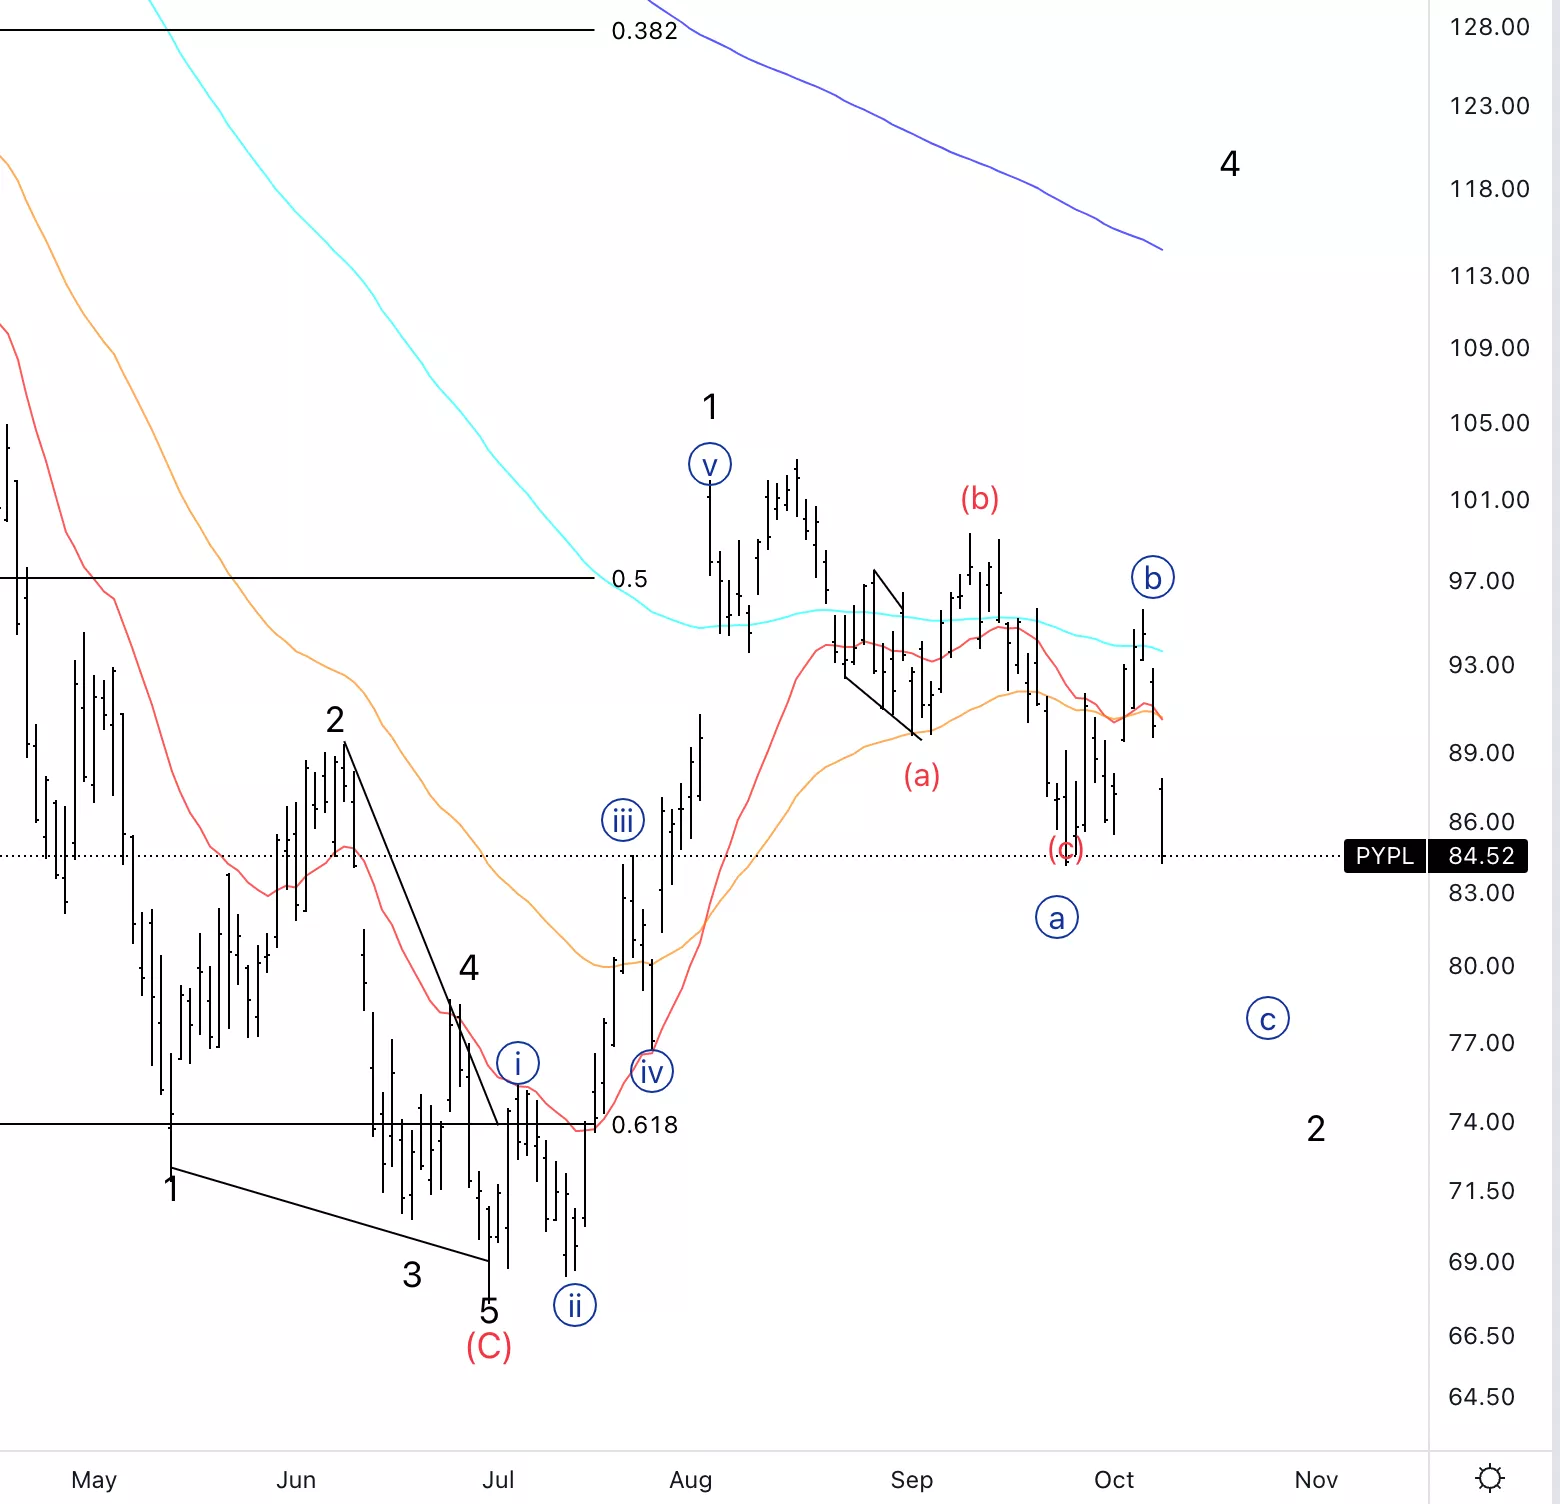
PayPal Holdings Inc., (PYPL): Daily Chart, October 11 2022,
PYPL Stock Market Analysis: Looking for further downside to complete the overall correction into wave 2.
PYPL Elliott Wave count: {c} of 2
PYPL Technical Indicators: We are below all averages, with the 20EMA previously acting as resistance.
PYPL Trading Strategy: Looking to take short term trades(intraday) to the downside as the trend is currently bearish.
TradingLounge Analyst: Alessio Barretta
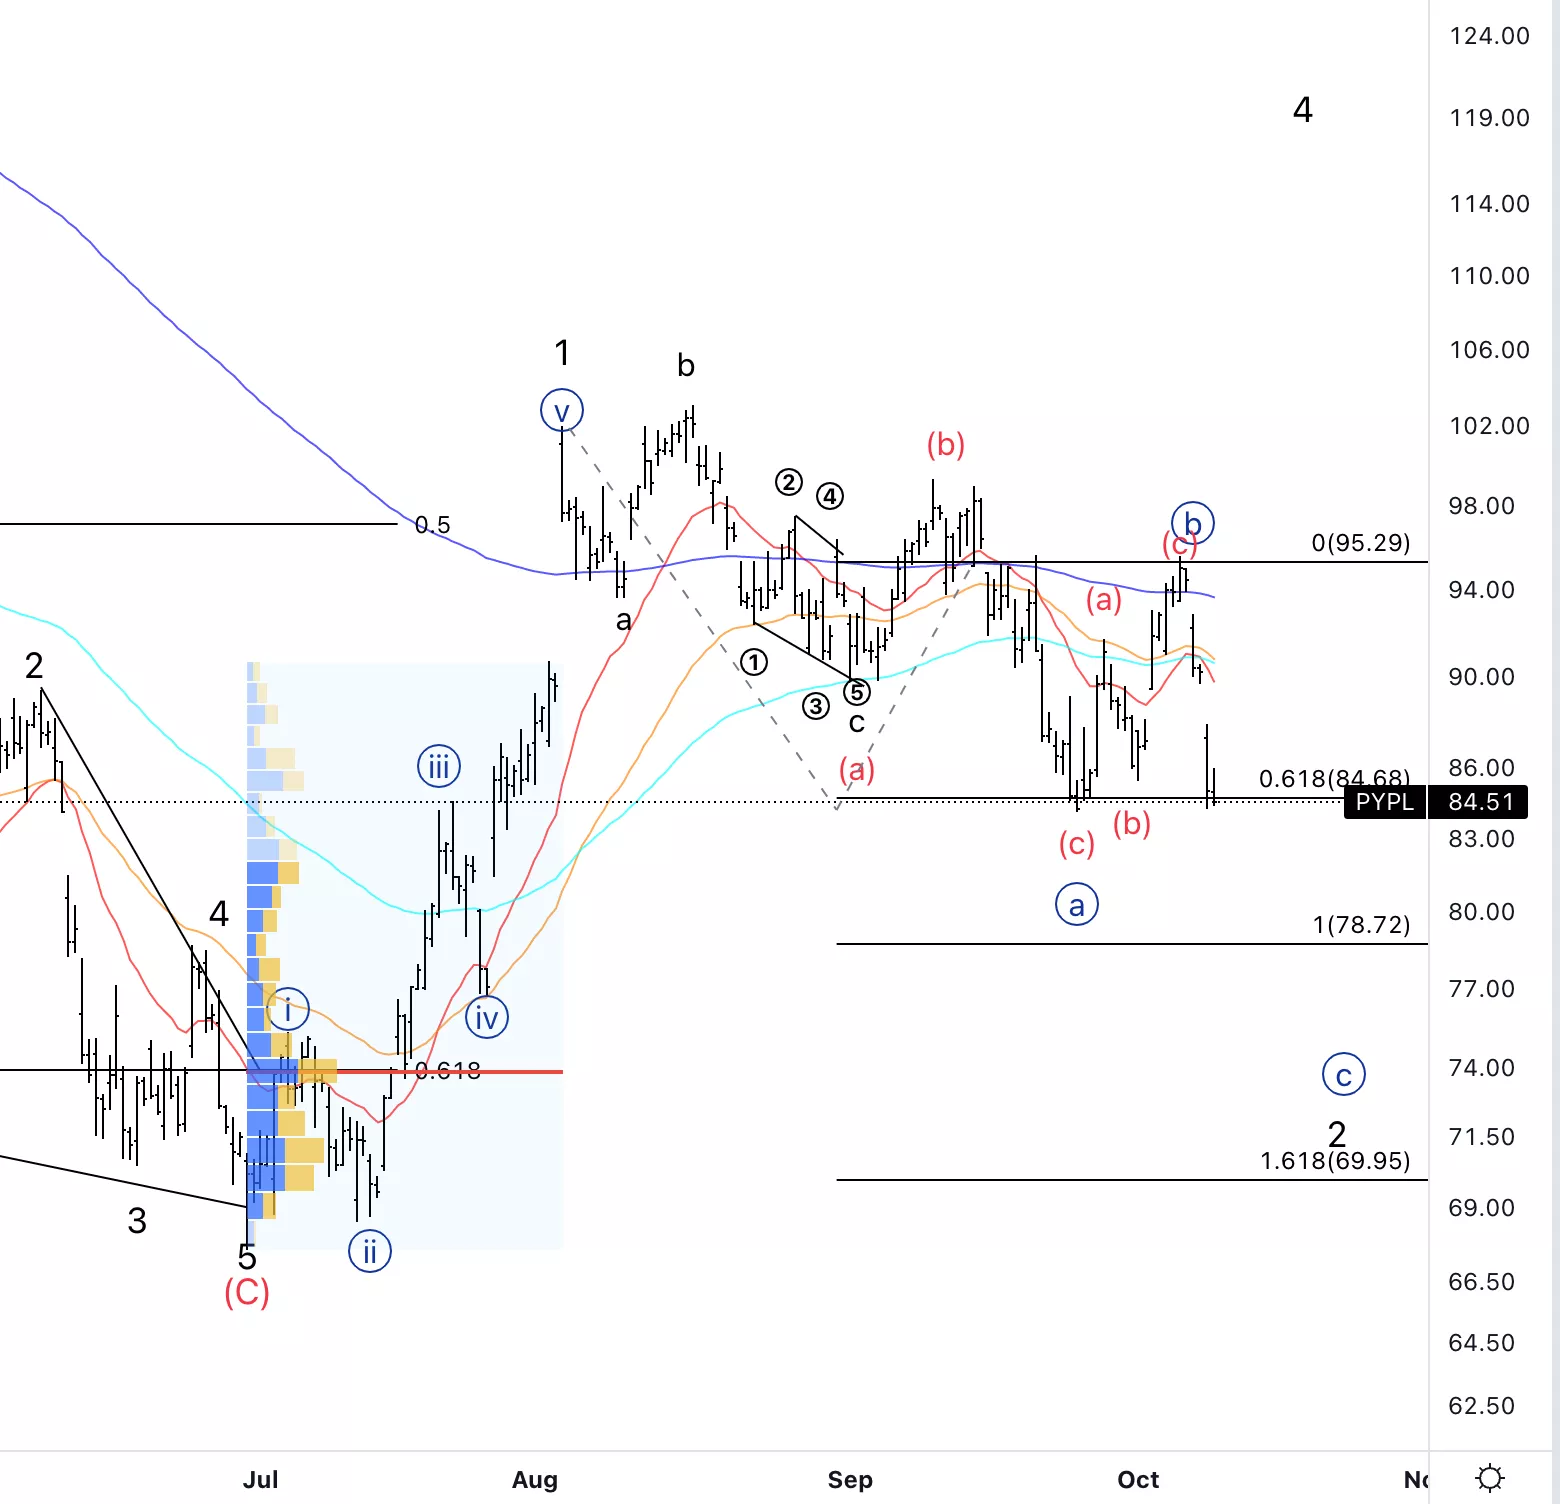
PayPal Holdings Inc., PYPL: 4-hour Chart, October 11 2022
PayPal Holdings Inc., Elliott Wave Technical Analysis
PYPL Stock Market Analysis: Looking for further downside to reach at least equality of {a} vs {c} at 78$ and maybe even lower to meet the volume point of control.
PYPL Elliott Wave count: {c} of 2.
PYPL Technical Indicators: Below all averages.
PYPL Trading Strategy: Looking to take short term trades to the downside until we meet one of the previously cited support points.
More By This Author:
Elliott Wave Technical Analysis: Polkadot, Oct.11,
SP500 And ASX200 Australian Banks Resource Energy Stocks - Elliott Wave
S&P 500 Elliott Wave Analysis


Comments
Log in or sign up to join the conversation.