
Polkadot (DOT-X)
DOTUSD Elliott Wave Technical Analysis

Function: Follow trend
Mode: Motive
Structure: Impulse
Position: Wave (5)
Direction Next higher degrees: Wave ((5)) of Motive
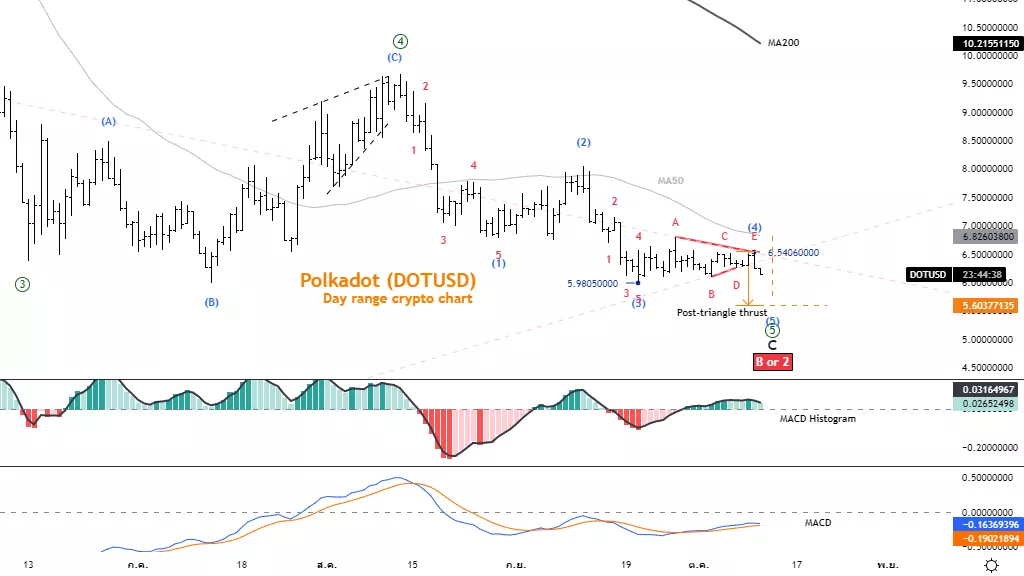
Details: The decrease in wave (5) tends to equal the thrust behind the triangular pattern at the 5.603 level.
Wave Cancel invalid level: 6.54
Polkadot (DOTUSD) Trading Strategy: Still in a downtrend. The decline in wave (5) is likely
to equal the momentum behind the triangle pattern at the 5.603 level. This could be a short-term trading opportunity in a downtrend.
Polkadot (DOTUSD)Technical Indicators: The price is below the MA50 and MA200 lines, MACD is below the Zero line, and the trend is bearish.
Polkadot (DOTUSD)
DOTUSD Elliott Wave Technical Analysis
Function: Follow trend
Mode: Motive
Structure: Impulse
Position: Wave (5)
Direction Next higher degrees: Wave ((5)) of Motive
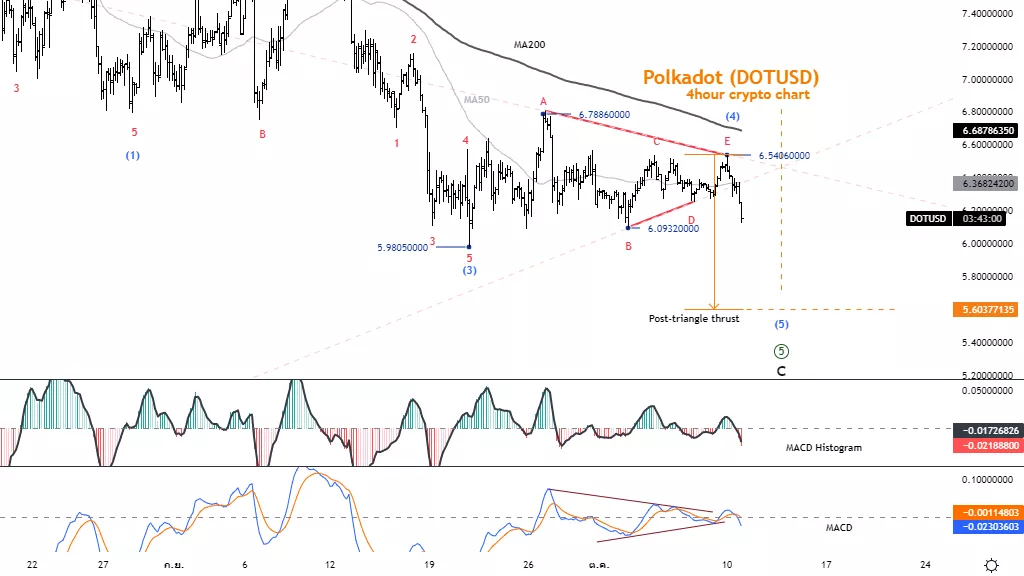
Details: The decrease in wave (5) tends to equal the thrust behind the triangular pattern at the 5.603 level.
Wave Cancel invalid level: 6.54
Polkadot (DOTUSD)Trading Strategy: Still in a downtrend. The decline in wave (5) is likely to equal the momentum behind the triangle pattern at the 5.603 level. This could be a
short-term trading opportunity in a downtrend.
Polkadot (DOTUSD)Technical Indicators: The price is below the MA50 and MA200 lines, MACD is below the Zero line, and the trend is bearish.
More By This Author:
SP500 And ASX200 Australian Banks Resource Energy Stocks - Elliott Wave
S&P 500 Elliott Wave Analysis
Uniswap Elliott Wave Technical Analysis 10 October 2022


Comments
Log in or sign up to join the conversation.