
Elliott Wave Technical Analysis: Palantir Technologies Inc. - Friday, Aug. 25

Image Source: Unsplash
Palantir Technologies Inc., Elliott Wave Technical Analysis
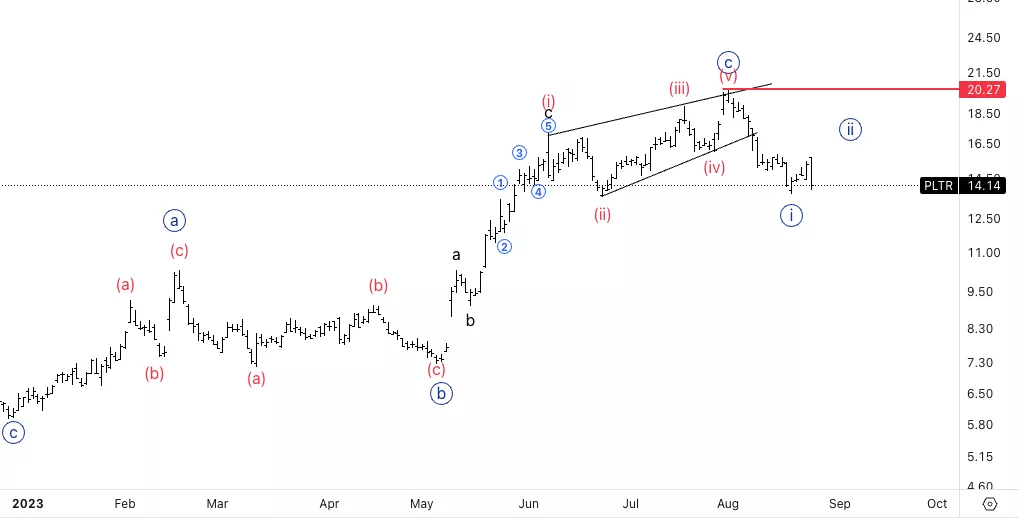
Palantir Technologies Inc., (Nasdaq: PLTR): Daily Chart 25 August 2023
PLTR Stock Market Analysis: We have been looking for a bearish count for quite some time now as we had a lack of evidence for a bullish count. Looking for continuation lower to go back to at least the area of wave {b} at 7$.
PLTR Elliott Wave Count: Wave {ii} of A/1
PLTR Technical Indicators: 20EMA as resistance
PLTR Trading Strategy: Looking for shorts into wave {iii}.
Analyst: Alessio Barretta
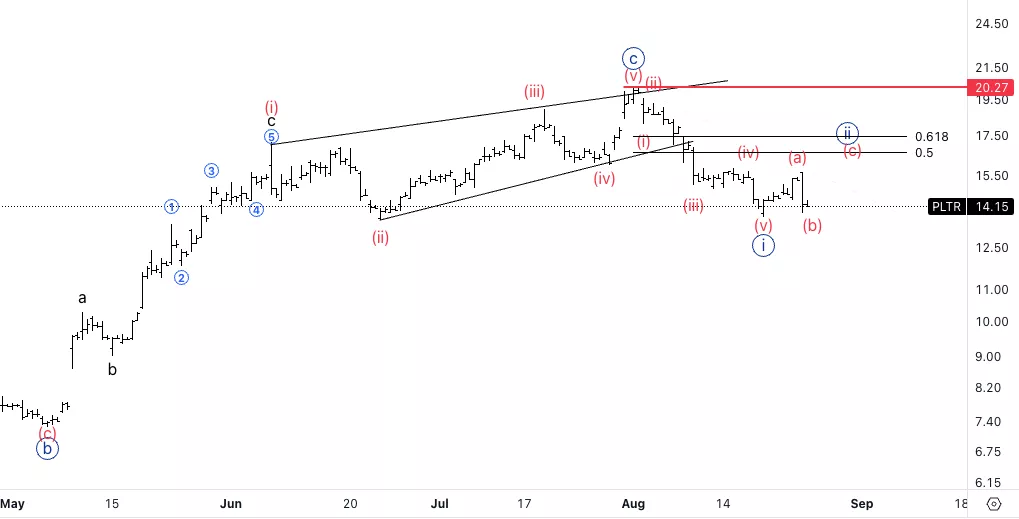
Palantir Technologies Inc., PLTR: 4-hour Chart 25 August 2023
Palantir Technologies Inc., Elliott Wave Technical Analysis
PLTR Stock Market Analysis: We can see a five wave move down into wave {i} and we now seem to be pulling back into wave {ii}. Most likely we will double correct higher into wave {ii}, but that is not compulsory.
PLTR Elliott Wave count: Wave (c) of {ii}.
PLTR Technical Indicators: 200EMA as support.
PLTR Trading Strategy: Looking for shorts once we get upside into wave (c).s
More By This Author:
Elliott Wave Technical Analysis Day Chart: U.S. Dollar/Japanese Yen - Friday, Aug. 25
Elliott Wave Technical Analysis: Binance Coin/U.S. Dollar - Friday, Aug. 25
Commodities And Futures Trading Market Report
Analyst Peter Mathers TradingLounge™ Australian Financial Services Licence - AFSL 317817


