Friday, February 17, 2023 10:21 AM EST

Image Source: Pixabay
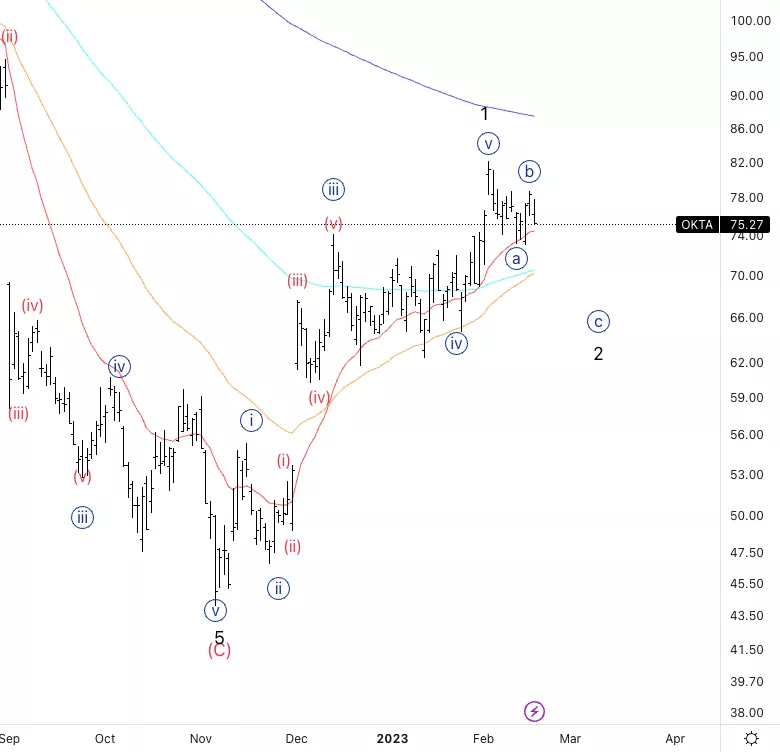
Okta Inc., Elliott Wave Technical Analysis
Okta Inc., (Nasdaq: OKTA): Daily Chart, 17 February 2023.
OKTA Stock Market Analysis: It kept moving as expected after the exited the trade in profit last month. At this point, we can expect a three wave move which seems to have started already and we could be ready to resume lower into wave {c}.
OKTA Elliott Wave Count: Wave {c} of 2.
OKTA Technical Indicators: Above all averages
OKTA Trading Strategy: Looking for a bottom in wave 2 to then look for longs, we could also double correct and this move could just be wave {a} of 2.
Analyst: Alessio Barretta
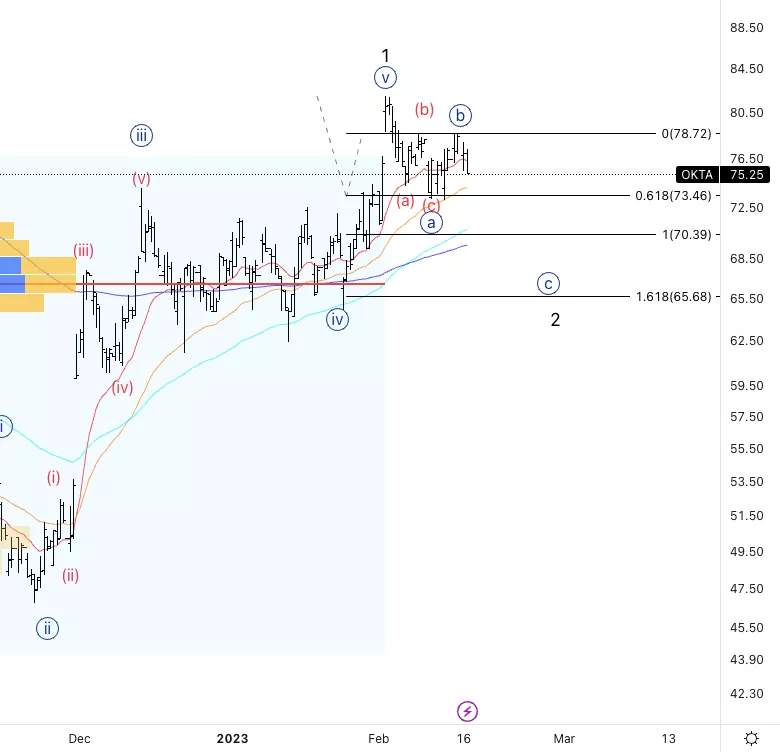
Okta Inc., OKTA: 4-hour Chart, 17 February 2023.
Okta Inc., Elliott Wave Technical Analysis
OKTA Stock Market Analysis: It looks like we have had three wave to the downside in wave {a}, however, it could also be counted as five down as a diagonal.
OKTA Elliott Wave count: Wave {c} of 2.
OKTA Technical Indicators: 20EMA as resistance.
ISRG Trading Strategy: Looking for support at around 65$ where we have both 1.618 {c} vs. {a} as well as the highest volume.
More By This Author:
Elliott Wave Technical Analysis: Bitcoin / U.S. Dollar - Friday, Feb. 17
SP500, Nasdaq, Russell 2000 And Dow Jones - Elliott Wave Technical Analysis
Elliott Wave Technical Analysis: Gilead Inc.
Disclosure: As with any trading or investment opportunity there is a risk of making losses especially in day trading or investments that Trading Lounge expresses opinions on. Note: Historical ...
more
Disclosure: As with any trading or investment opportunity there is a risk of making losses especially in day trading or investments that Trading Lounge expresses opinions on. Note: Historical trading results are no guarantee of future returns. Some investments are inherently more risky than others. At worst, you could lose your entire investment and more TradingLounge™ uses a range of technical analysis tools, such as Elliott Wave, software and basic fundamental analysis as well as economic forecasts aimed at minimising the potential for loss. The advice we provide through our TradingLounge™ websites and our TradingLounge™ Membership has been prepared without taking into account your particular objectives, financial situation or needs. Reliance on such advice, information or data is at your own risk. The decision to trade and the method of trading is for you alone to decide, tradinglounge takes no responsibility whatsoever for your trading profits or losses. This information is of a general nature only, so you should, before acting upon any of the information or advice provided by us, consider the appropriateness of the advice in light of your own objectives, financial situation or needs. Therefore, you should consult your financial advisor or accountant to determine whether trading in Indices Stocks shares Forex CFDs Options Spread Betting derivatives of any kind / products is appropriate for you in light of your financial trading circumstances.
less
How did you like this article? Let us know so we can better customize your reading experience.


